Interaction Diagram - Tied Reinforced Concrete Column
Interaction Diagram - Tied Reinforced Concrete Column
Interaction Diagram - Tied Reinforced Concrete Column
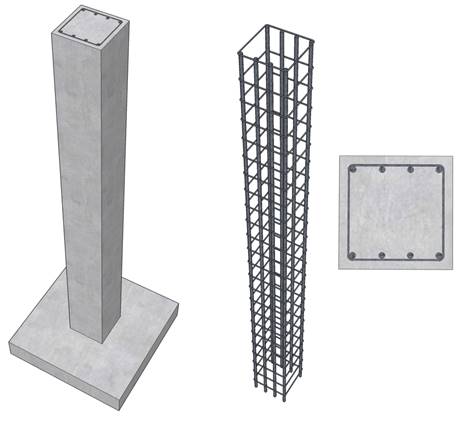
Develop an interaction diagram for the square tied concrete column shown in the figure below about the x-axis. Determine seven control points on the interaction diagram and compare the calculated values in the Reference and with exact values from the complete interaction diagram generated by spColumn engineering software program from StructurePoint.
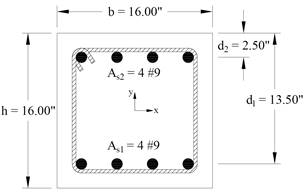
Figure 1 – Reinforced Concrete Column Cross-Section
Contents
1.1. Nominal axial compressive strength at zero eccentricity
1.2. Factored axial compressive strength at zero eccentricity
1.3. Maximum (allowable) factored axial compressive strength
2. Bar Stress Near Tension Face of Member Equal to Zero, ( εs = fs = 0 )
2.1. c, a, and strains in the reinforcement
2.2. Forces in the concrete and steel
3. Bar Stress Near Tension Face of Member Equal to 0.5 fy, ( fs = - 0.5 fy )
3.1. c, a, and strains in the reinforcement
3.2. Forces in the concrete and steel
4. Bar Stress Near Tension Face of Member Equal to fy, ( fs = - fy )
4.1. c, a, and strains in the reinforcement
4.2. Forces in the concrete and steel
5. Bar Strain Near Tension Face of Member Equal to 0.005 in./in., ( εs = - 0.005 in./in.)
5.1. c, a, and strains in the reinforcement
5.2. Forces in the concrete and steel
6.1. c, a, and strains in the reinforcement
6.2. Forces in the concrete and steel
8. Column Interaction Diagram - spColumn Software
9. Summary and Comparison of Design Results
10. Conclusions & Observations
Code
Building Code Requirements for Structural Concrete (ACI 318-14) and Commentary (ACI 318R-14)
Reference
Reinforced Concrete Mechanics and Design, 6th Edition, 2011, James Wight and James MacGregor, Pearson
Design Data
fc’ = 5000 psi
fy = 60,000 psi
Cover = 2.5 in. to the center of the reinforcement
Column 16 in. x 16 in.
Top reinforcement = 4 #9
Bottom reinforcement = 4 #9
Solution
Use the traditional hand calculations approach to generate the interaction diagram for the concrete column section shown above by determining the following seven control points:
Point 1: Pure compression
Point 2: Bar stress near tension face of member equal to zero, ( fs = 0 )
Point 3: Bar stress near tension face of member equal to 0.5 fy ( fs = - 0.5 fy )
Point 4: Bar stress near tension face of member equal to fy ( fs = - fy )
Point 5: Bar strain near tension face of member equal to 0.005
Point 6: Pure bending
Point 7: Pure tension
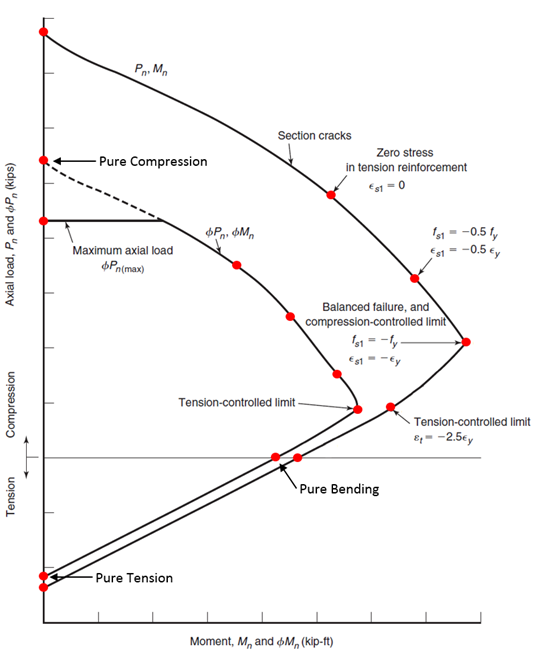
Figure 2 – Control Points
![]() ACI
318-14 (22.4.2.2)
ACI
318-14 (22.4.2.2)
![]()
Since this column is a tied column with steel strain in compression:
![]() ACI
318-14 (Table 21.2.2)
ACI
318-14 (Table 21.2.2)
![]()
![]() ACI
318-14 (Table 22.4.2.1)
ACI
318-14 (Table 22.4.2.1)
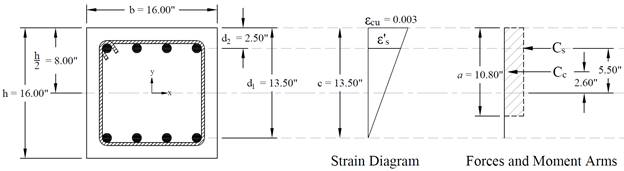
Figure 3 – Strains, Forces, and Moment Arms (εt = fs = 0)
Strain εs is zero in the extreme layer of tension steel. This case is considered when calculating an interaction diagram because it marks the change from compression lap splices being allowed on all longitudinal bars, to the more severe requirement of tensile lap splices. ACI 318-14 (10.7.5.2.1 and 2)
![]()
Where c is the distance from the fiber of maximum compressive strain to the neutral axis.
ACI 318-14 (22.2.2.4.2)
![]() ACI 318-14 (22.2.2.4.1)
ACI 318-14 (22.2.2.4.1)
Where:
a = Depth of equivalent rectangular stress block
![]() [IMA1] ACI 318-14 (Table 22.2.2.4.3)
[IMA1] ACI 318-14 (Table 22.2.2.4.3)
![]()
![]() ACI
318-14 (Table 21.2.2)
ACI
318-14 (Table 21.2.2)
![]() ACI
318-14 (22.2.2.1)
ACI
318-14 (22.2.2.1)
![]()
![]() ACI 318-14 (22.2.2.4.1)
ACI 318-14 (22.2.2.4.1)
![]()
![]()
![]()
The area of the reinforcement in this layer has been included in the area (ab) used to compute Cc. As a result, it is necessary to subtract 0.85fc’ from fs’ before computing Cs:
![]()
![]()
![]()
![]()
![]()
![]()
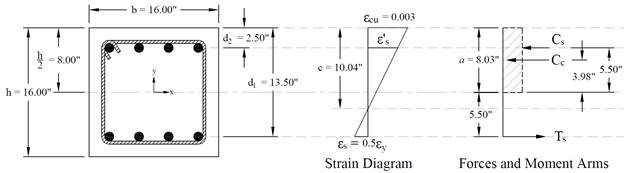
Figure 4 – Strains, Forces, and Moment Arms (fs = - 0.5 fy)
![]()
![]()
![]() ACI
318-14 (Table 21.2.2)
ACI
318-14 (Table 21.2.2)
![]() ACI
318-14 (22.2.2.1)
ACI
318-14 (22.2.2.1)
![]()
Where c is the distance from the fiber of maximum compressive strain to the neutral axis.
ACI 318-14 (22.2.2.4.2)
![]() ACI 318-14 (22.2.2.4.1)
ACI 318-14 (22.2.2.4.1)
Where:
![]() ACI 318-14 (Table 22.2.2.4.3)
ACI 318-14 (Table 22.2.2.4.3)
![]()
![]() ACI 318-14 (22.2.2.4.1)
ACI 318-14 (22.2.2.4.1)
![]()
![]()
![]()
![]()
The area of the reinforcement in this layer has been included in the area (ab) used to compute Cc. As a result, it is necessary to subtract 0.85fc’ from fs’ before computing Cs:
![]()
![]()
![]()
![]()
![]()
![]()
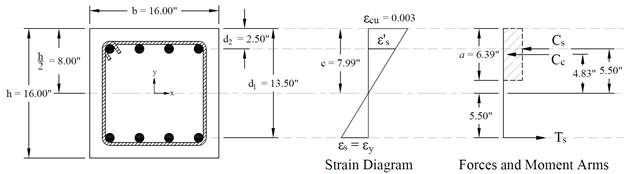
Figure 5 – Strains, Forces, and Moment Arms (fs = - fy)
This strain distribution is called the balanced failure case and the compression-controlled strain limit. It marks the change from compression failures originating by crushing of the compression surface of the section, to tension failures initiated by yield of longitudinal reinforcement. It also marks the start of the transition zone for ϕ for columns in which ϕ increases from 0.65 (or 0.75 for spiral columns) up to 0.90.
![]()
![]()
![]() ACI
318-14 (Table 21.2.2)
ACI
318-14 (Table 21.2.2)
![]() ACI
318-14 (22.2.2.1)
ACI
318-14 (22.2.2.1)
![]()
Where c is the distance from the fiber of maximum compressive strain to the neutral axis.
ACI 318-14 (22.2.2.4.2)
![]() ACI 318-14 (22.2.2.4.1)
ACI 318-14 (22.2.2.4.1)
Where:
![]() ACI 318-14 (Table 22.2.2.4.3)
ACI 318-14 (Table 22.2.2.4.3)
![]()
![]() ACI 318-14 (22.2.2.4.1)
ACI 318-14 (22.2.2.4.1)
![]()
![]()
![]()
![]()
The area of the reinforcement in this layer has been included in the area (ab) used to compute Cc. As a result, it is necessary to subtract 0.85fc’ from fs’ before computing Cs:
![]()
![]()
![]()
![]()
![]()
![]()
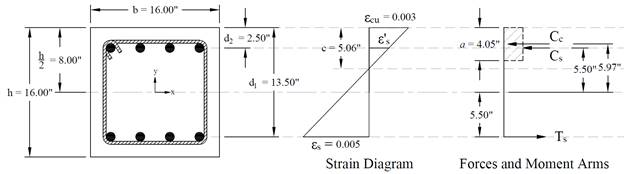
Figure 6 – Strains, Forces, and Moment Arms (εs = - 0.005 in./in.)
This corresponds to the tension-controlled strain limit of 0.005. It is the strain at the tensile limit of the transition zone for ϕ, used to define a tension-controlled section.
![]()
![]()
![]() ACI
318-14 (Table 21.2.2)
ACI
318-14 (Table 21.2.2)
![]() ACI
318-14 (22.2.2.1)
ACI
318-14 (22.2.2.1)
![]()
Where c is the distance from the fiber of maximum compressive strain to the neutral axis.
ACI 318-14 (22.2.2.4.2)
![]() ACI 318-14 (22.2.2.4.1)
ACI 318-14 (22.2.2.4.1)
Where:
![]() ACI 318-14 (Table 22.2.2.4.3)
ACI 318-14 (Table 22.2.2.4.3)
![]()
![]() ACI 318-14 (22.2.2.4.1)
ACI 318-14 (22.2.2.4.1)
![]()
![]()
![]()
![]()
The area of the reinforcement in this layer has been included in the area (ab) used to compute Cc. As a result, it is necessary to subtract 0.85fc’ from fs’ before computing Cs:
![]()
![]()
![]()
![]()
![]()
![]()
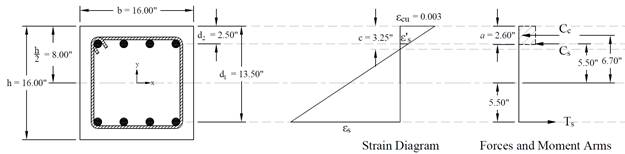
Figure 7 – Strains, Forces, and Moment Arms (Pure Moment)
This corresponds to the case where the nominal axial load capacity, Pn, is equal to zero. Iterative procedure is used to determine the nominal moment capacity as follows:
![]()
Where c is the distance from the fiber of maximum compressive strain to the neutral axis.
ACI 318-14 (22.2.2.4.2)
![]() ACI 318-14 (22.2.2.4.1)
ACI 318-14 (22.2.2.4.1)
Where:
![]() ACI 318-14 (Table 22.2.2.4.3)
ACI 318-14 (Table 22.2.2.4.3)
![]() ACI
318-14 (22.2.2.1)
ACI
318-14 (22.2.2.1)
![]()
![]()
![]() ACI
318-14 (Table 21.2.2)
ACI
318-14 (Table 21.2.2)
![]()
![]() ACI 318-14 (22.2.2.4.1)
ACI 318-14 (22.2.2.4.1)
![]()
![]()
![]()
![]()
The area of the reinforcement in this layer has been included in the area (ab) used to compute Cc. As a result, it is necessary to subtract 0.85fc’ from fs’ before computing Cs:
![]()
![]()
The assumption that c = 3.25 in. is correct
![]()
![]()
![]()
The final loading case to be considered is concentric axial tension. The strength under pure axial tension is computed by assuming that the section is completely cracked through and subjected to a uniform strain greater than or equal to the yield strain in tension. The strength under such a loading is equal to the yield strength of the reinforcement in tension.
![]() ACI 318-14 (22.4.3.1)
ACI 318-14 (22.4.3.1)
![]() ACI
318-14 (Table 21.2.2)
ACI
318-14 (Table 21.2.2)
![]()
Since the section is symmetrical
![]()
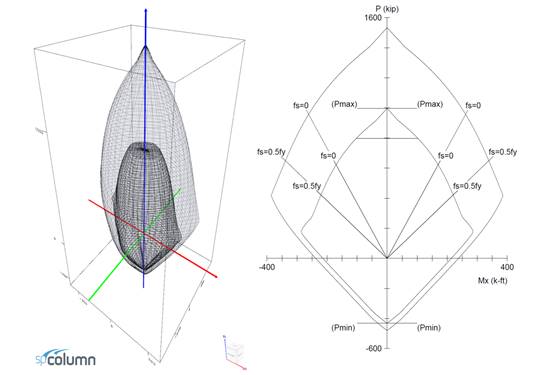
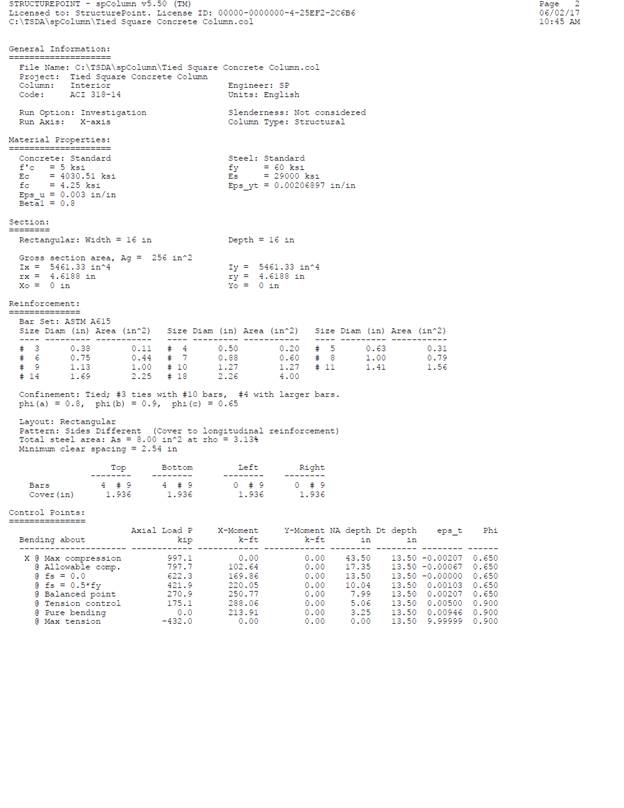
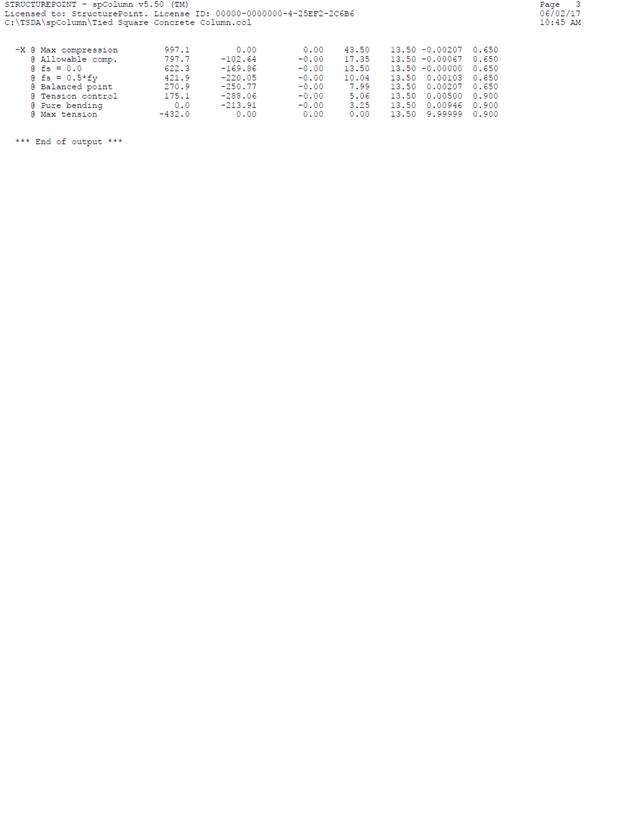
spColumn program performs the analysis of the reinforced concrete section conforming to the provisions of the Strength Design Method and Unified Design Provisions with all conditions of strength satisfying the applicable conditions of equilibrium and strain compatibility. For this column section, we ran in investigation mode with control points using the 318-14. In lieu of using program shortcuts, spSection (Figure 9) was used to place the reinforcement and define the cover to illustrate handling of irregular shapes and unusual bar arrangement.
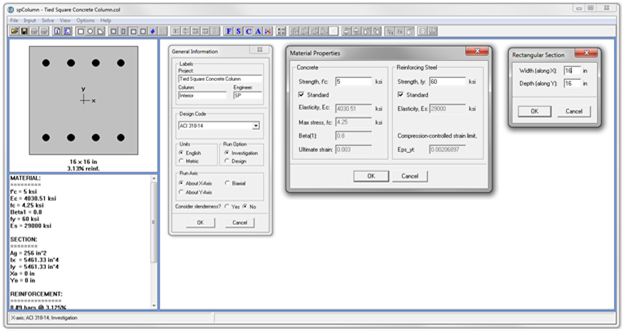
Figure 8 – Generating spColumn Model

Figure 9 – spColumn Model Editor (spSection)
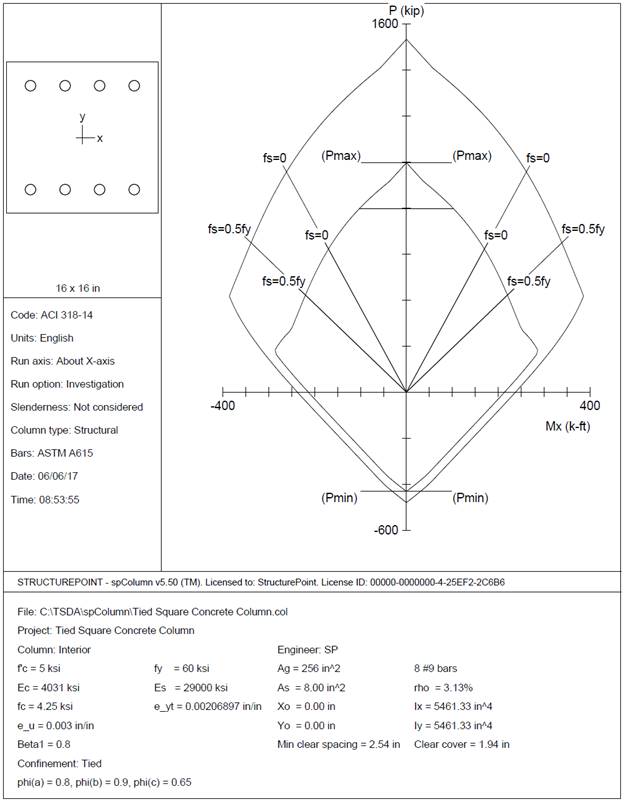
Figure 10 – Column Section Interaction Diagram about the X-Axis (spColumn)
|
Table 1 - Comparison of Results |
||||||
|
Support |
ϕPn, kip |
ϕMn, kip.ft |
||||
|
Hand |
Reference* |
Hand |
Reference* |
|||
|
Max compression |
997 |
997 |
997 |
0 |
0 |
0 |
|
Allowable compression |
798 |
798 |
798 |
--- |
--- |
--- |
|
fs = 0.0 |
622 |
622 |
622 |
170 |
170 |
170 |
|
fs = 0.5 fy |
422 |
422 |
422 |
220 |
220 |
220 |
|
Balanced point |
271 |
271 |
271 |
251 |
251 |
251 |
|
Tension control |
175 |
175 |
175 |
288 |
288 |
288 |
|
Pure bending |
0 |
0 |
0 |
214 |
214 |
214 |
|
Max tension |
432 |
432 |
432 |
0 |
0 |
0 |
|
* Reinforced Concrete Mechanic and Design, 6th Edition, James Wight & MacGregor – Example 11-1 |
||||||
In all of the hand calculations and the reference used illustrated above, the results are in precise agreement with the automated exact results obtained from the spColumn program.
The analysis of the reinforced concrete section performed by spColumn conforms to the provisions of the Strength Design Method and Unified Design Provisions with all conditions of strength satisfying the applicable conditions of equilibrium and strain compatibility.
In the calculation shown above a P-M interaction diagram was generated with moments about the X-Axis (Uniaxial bending). Since the reinforcement in the section is not symmetrical, a different P-M interaction diagram is needed for the other orthogonal direction about the Y-Axis (See the following Figure for the case where fs = fy).
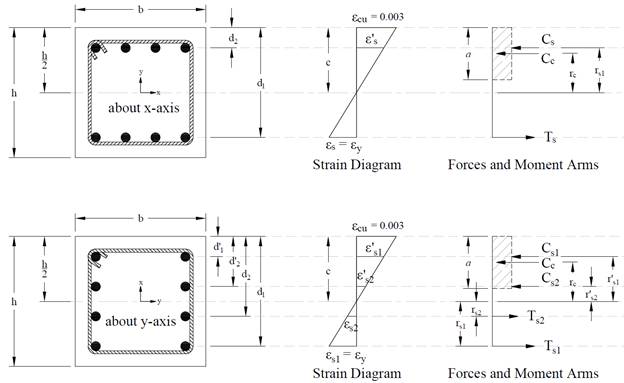
Figure 11 – Strains, Forces, and Moment Arms (fs = - fy Moments About x- and y-axis)
When running about the Y-Axis, we have 2 bars in 4 layers instead of 4 bars in just 2 layers (about X-Axis) resulting in a completely different interaction diagram as shown in the following Figure.
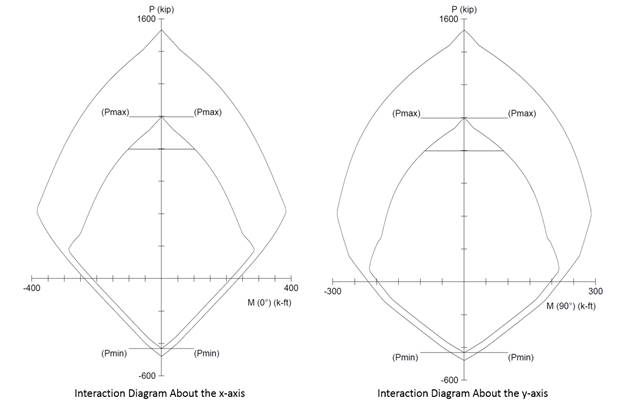
Figure 12 – Comparison of Column Interaction Diagrams about X-Axis and Y-Axis (spColumn)
Further differences in the interaction diagram in both directions can result if the column cross section geometry is irregular.
In most building design calculations, such as the examples shown for flat plate or flat slab concrete floor systems, all building columns are subjected to Mx and My due to lateral forces and unbalanced moments from both directions of analysis. This requires an evaluation of the column P-M interaction diagram in two directions simultaneously (biaxial bending).
StucturePoint’s spColumn program can also evaluate column sections in biaxial mode to produce the results shown in the following Figure for the column section in this example.
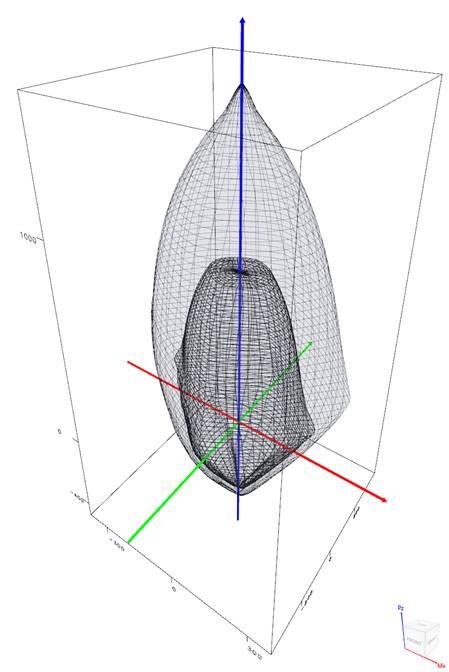
Figure 13 – Nominal & Design Interaction Diagram in Two Directions (Biaxial) (spColumn)
- [IMA1]Instead of x