Reinforced Concrete Shear Wall Analysis and Design
Reinforced Concrete Shear Wall Analysis and Design
Reinforced Concrete Shear Wall Analysis and Design
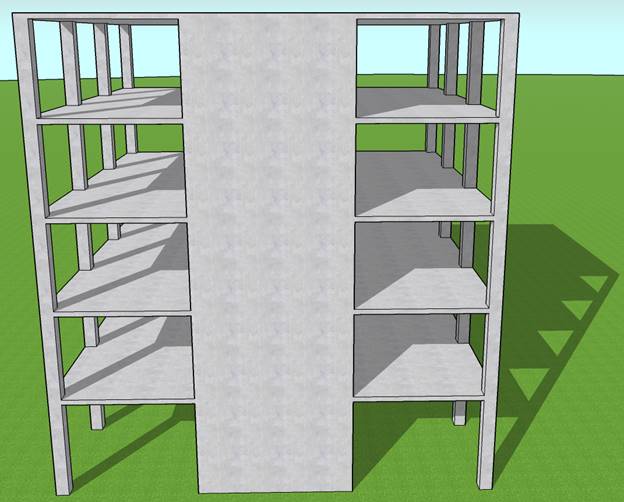
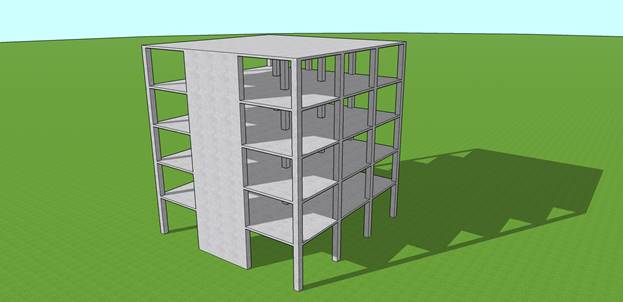
A structural reinforced concrete shear wall in a 5-story building provides lateral and gravity load resistance for the applied load as shown in the figure below. Shear wall section and assumed reinforcement is investigated after analysis to verify suitability for the applied loads.
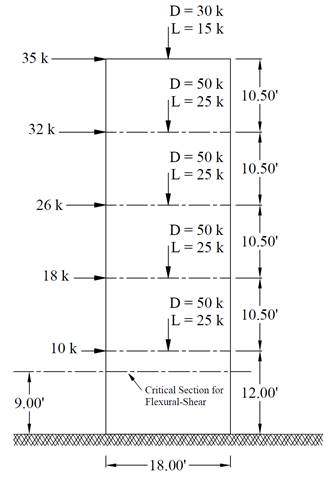
Figure 1 – Reinforced Concrete Shear Wall Geometry and Loading
Contents
1. Minimum Reinforcement Requirements (Reinforcement Percentage and Spacing)
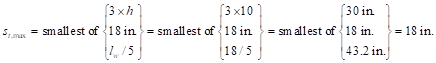
1.1. Horizontal Reinforcement Check
1.2. Vertical Reinforcement Check
2. Neutral Axis Depth Determination
5. Shear Wall Analysis and Design – spWall Software
6. Design Results Comparison and Conclusions
Code
Building Code Requirements for Structural Concrete (ACI 318-14) and Commentary (ACI 318R-14)
Reference
Reinforced Concrete Mechanics and Design, 7th Edition, 2016, James Wight, Pearson, Example 18-2
Design Data
fc’ = 4,000 psi normal weight concrete
fy = 60,000 psi
Slab thickness = 7 in.
Wall thickness = 10 in.
Wall length = 18 ft
Vertical reinforcement: #5 bars at 18 in. on centers in each face (As, vertical = #5 @ 18 in.)
Horizontal reinforcement: #4 bars at 16 in. on centers in each face (As, horizontal = #4 @ 16 in.)
![]() ACI 318-14 (2.2)
ACI 318-14 (2.2)
![]() ACI 318-14 (11.6.2(b))
ACI 318-14 (11.6.2(b))
 ACI 318-14 (11.7.3.1)
![]()
![]() ACI 318-14 (2.2)
ACI 318-14 (2.2)
 ACI 318-14 (11.6.2(a))
![]() ACI 318-14 (11.6.2(a))
ACI 318-14 (11.6.2(a))
 ACI 318-14 (11.7.2.1)
![]()
![]()
The load factor for strength-level wind force = 1.0
![]()
![]() ACI 318-14 (Eq.5.3.1f)
ACI 318-14 (Eq.5.3.1f)
![]() ACI 318-14 (Table 22.2.2.4.3)
ACI 318-14 (Table 22.2.2.4.3)
![]()
![]()
![]()
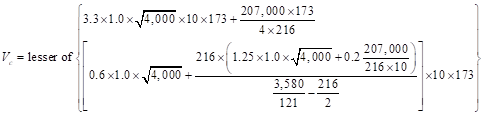
Assume the effective flexural depth (d) is approximately equal to 0.8lw = 173 in. ACI 318-14 (11.5.4.2)
![]()
![]() ACI
318-14 (Table 21.2.2)
ACI
318-14 (Table 21.2.2)
![]()
![]()
Taking into account the applied axial force and summing force moments about the compression force (C), the moment capacity can be computed as follows:
![]()
![]()
Since ϕMn is greater than Mu, the wall has adequate flexural strength.
To further confirm the moment capacity is adequate with detailed consideration for the axial compression, an interaction diagram using spColumn can be created easily as shown below for the wall section. The location of the neutral axis, maximum tensile strain, and the phi factor can all be also verified from the spColumn model results output parameters. As can be seen from the interaction diagram a comprehensive view of the wall behavior for any combination of axial force and applied moment.
For a factored axial and moment of 207 kips and 4670 kip-ft the interaction diagram shows a capacity factor of 1.139 (ϕMn = 5,320 kip-ft for ϕPn = Pu), see Figures 11 and 12.
![]()
 ACI 318-14 (Table 11.5.4.6)
![]()
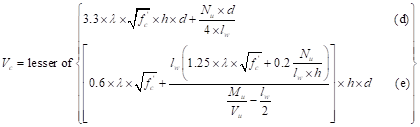
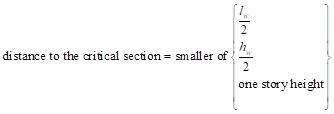
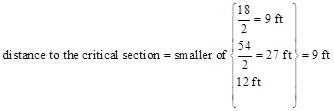
Where Mu/Vu ratio used in equation (e) was calculated at the critical section above the base of the wall (see Figure 1).
 ACI 318-14 (11.5.4.7)
The factored moment at the ultimate section is equals to:
![]()
![]()
![]() ACI 318-14 (Table 21.2.1)
ACI 318-14 (Table 21.2.1)
![]()
Thus, it is not required to calculate the additional shear strength provided by the horizontal reinforcement (Vs)
![]()
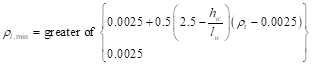
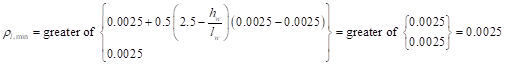
Since 0.5ϕVc is less than Vu, ρl shall be at least the greater of Equation 11.6.2 in the Code and 0.0025 but need not to exceed ρt required by Equation 11.5.4.8. and ρt shall be at least 0.0025. ACI 318-14 (11.6.2)
(Those requirements were checked in step 1).
spWall is a program for the analysis and design of reinforced concrete shear walls, tilt-up walls, precast wall and insulate concrete form (ICF) walls. It uses a graphical interface that enables the user to easily generate complex wall models. Graphical user interface is provided for:
· Wall geometry (including any number of openings and stiffeners)
· Material properties including cracking coefficients
· Wall loads (point, line, and area),
· Support conditions (including translational and rotational spring supports)
spWall uses the Finite Element Method for the structural modeling, analysis, and design of slender and non-slender reinforced concrete walls subject to static loading conditions. The wall is idealized as a mesh of rectangular plate elements and straight line stiffener elements. Walls of irregular geometry are idealized to conform to geometry with rectangular boundaries. Plate and stiffener properties can vary from one element to another but are assumed by the program to be uniform within each element.
Six degrees of freedom exist at each node: three translations and three rotations relating to the three Cartesian axes. An external load can exist in the direction of each of the degrees of freedom. Sufficient number of nodal degrees of freedom should be restrained in order to achieve stability of the model. The program assembles the global stiffness matrix and load vectors for the finite element model. Then, it solves the equilibrium equations to obtain deflections and rotations at each node. Finally, the program calculates the internal forces and internal moments in each element. At the user’s option, the program can perform second order analysis. In this case, the program takes into account the effect of in-plane forces on the out-of-plane deflection with any number of openings and stiffeners.
In spWall, the required flexural reinforcement is computed based on the selected design standard (ACI 318-14 is used in this example), and the user can specify one or two layers of shear wall reinforcement. In stiffeners and boundary elements, spWall calculates the required shear and torsion steel reinforcement. Shear wall concrete strength (in-plane and out-of-plane) is calculated for the applied loads and compared with the code permissible shear capacity.
For illustration and comparison purposes, the following figures provide a sample of the input modules and results obtained from an spWall model created for the reinforced concrete shear wall in this example.
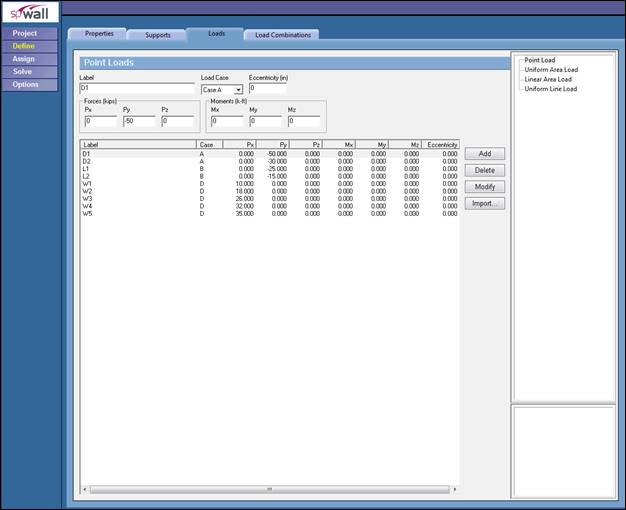
Figure 2 –Defining Loads for Shear Wall (spWall)
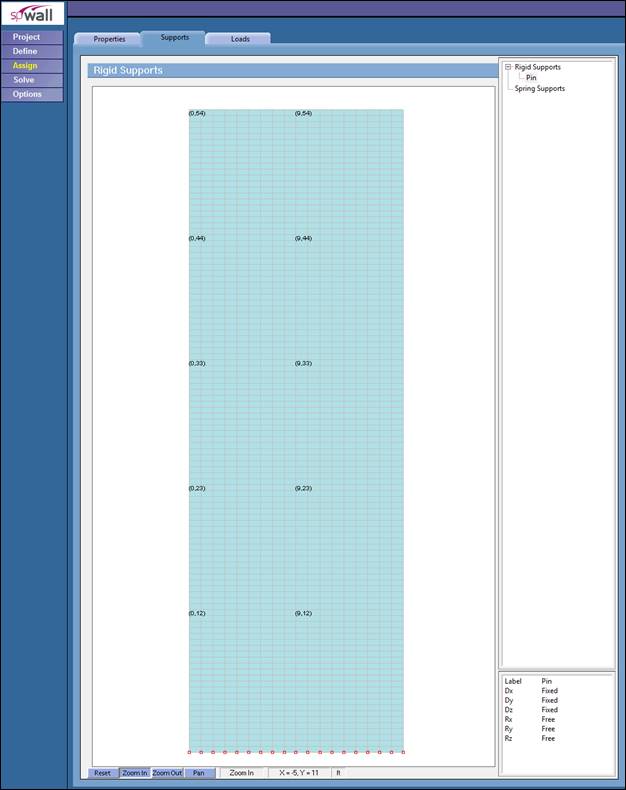
Figure 3 – Assigning Boundary Conditions for Shear Wall (spWall)
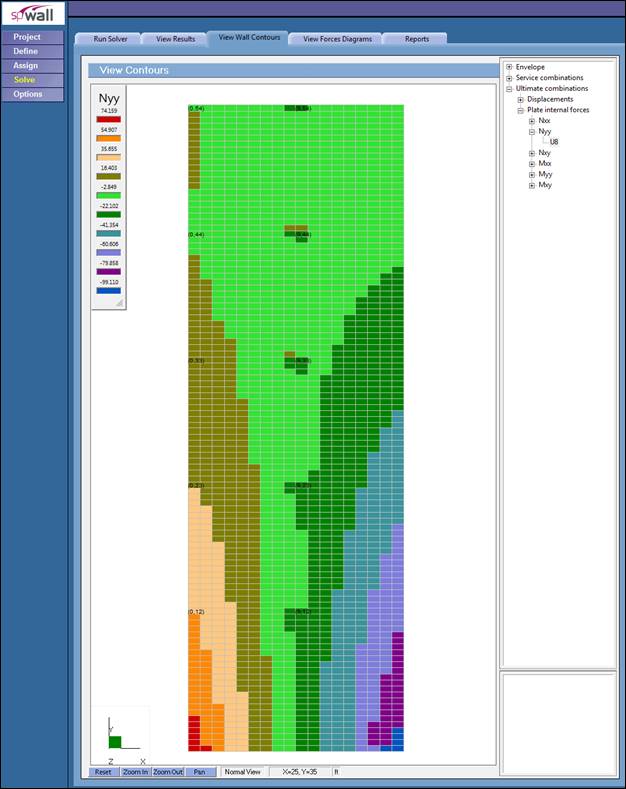
Figure 4 –Factored Axial Forces Contour Normal to Shear Wall Cross-Section (spWall)
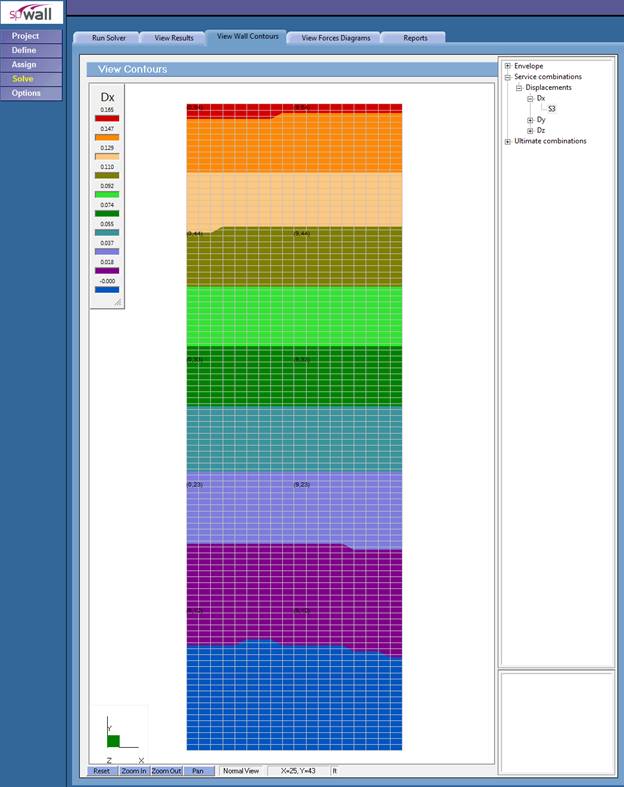
Figure 5 – Shear Wall Lateral Displacement Contour (spWall)
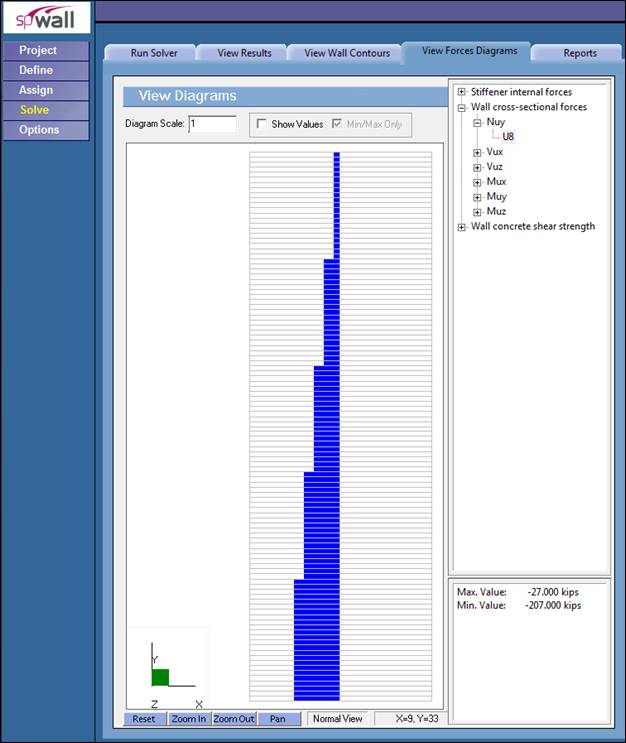
Figure 6 – Shear Wall Axial Load Diagram (spWall)
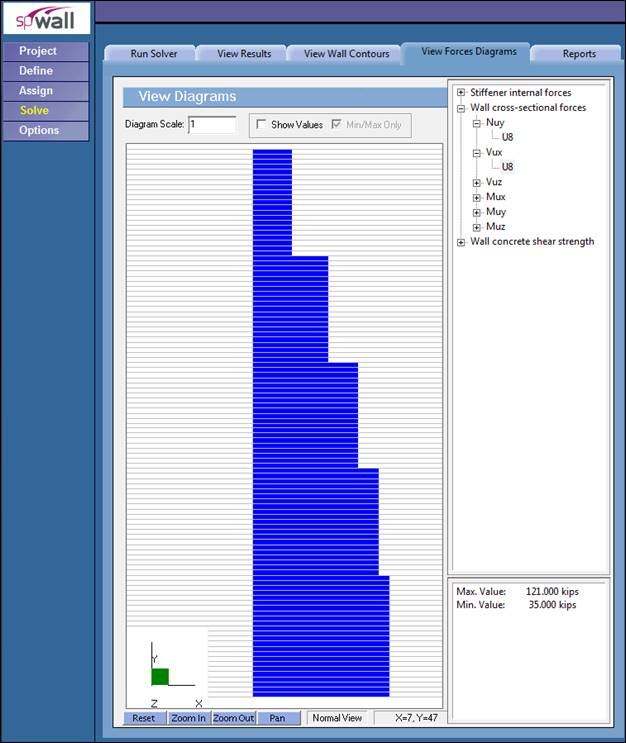
Figure 7 – In-plane Shear Diagram (spWall)
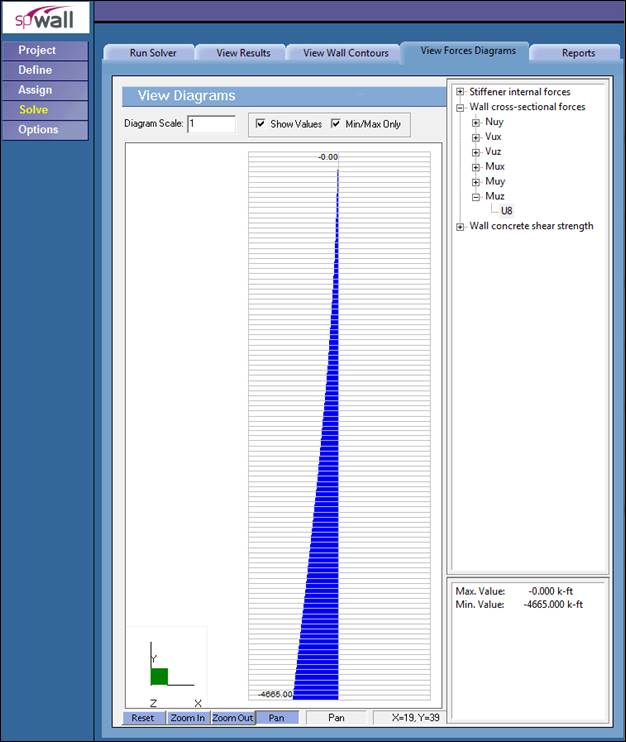
Figure 8 – Shear Wall Moment Diagram (spWall)
![]()
![]()
![]()
![]()
![]()
![]()
![]()
![]()
![]()
![]()
![]()
![]()
![]()
![]()
![]()
![]()
![]()
![]()
![]()
![]()
![]()
![]()
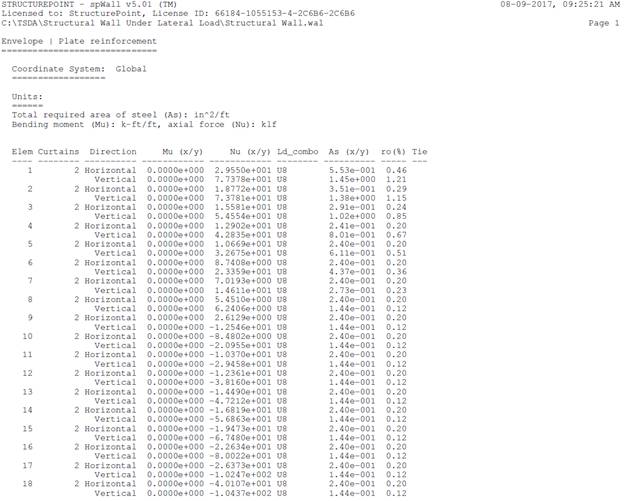
Figure 9 – Shear Wall Vertical Reinforcement (spWall)
![]()
![]()
![]()
![]()
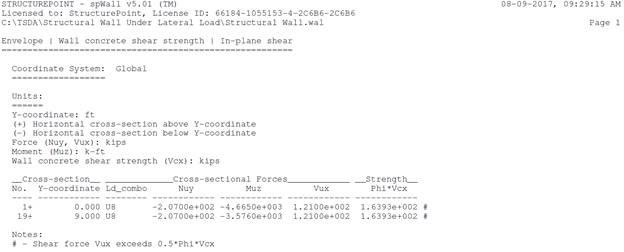
Figure 10 – Concrete Shear Strength and Shear Wall Cross-Sectional Forces (spWall)
|
Table 1 – Comparison of Shear Wall Analysis and Design Results |
|||||||
|
Solution |
Wall Cross-Sectional Forces |
Strength |
Required As |
Provided As |
|||
|
Mu (kip-ft) |
Nu (kips) |
Vu (kips) |
Mu@critical Section (kip-ft) |
ϕVc (kips) |
As,vertical (in.2) |
As,vertical (in.2) |
|
|
Hand |
4,670 |
207 |
121 |
3,580 |
161 |
Governed by Min. |
7.44 |
|
Reference |
4,670 |
207 |
121 |
3,580 |
161 |
Governed by Min. |
7.44 |
|
spWall |
4,665 |
207 |
121 |
3,576 |
164 |
Governed by Min. |
7.56 |
The results of all the hand calculations and the reference used illustrated above are in precise agreement with the automated exact results obtained from the spWall program. It is worth noting that the minimum area of steel is governed by the minimum reinforcement ratio stipulated by the code. The same can be seen in spWall output for elements 9 through 18.
In the hand calculations and the reference, a simplified procedure to calculate the nominal flexural strength was used (A. E. Cardenas et al.). In this procedure, several broad assumptions are made to avoid tedious detailed calculations:
· All steel in the tension zone yields in tension.
· All steel in the compression zone yields in compression.
· The tension force acts at mid-depth of the tension zone.
· The total compression force (sum of steel and concrete contributions) acts at mid-depth of the compression zone.
To investigate the exact shear wall cross section capacity, a detailed interaction diagram can be easily generated by spColumn conforming to the provisions of the Strength Design Method and Unified Design Provisions with all conditions of strength satisfying the applicable conditions of equilibrium and strain compatibility.
For illustration and comparison purposes, following figures provide a sample of the input and output of the exact results obtained from an spColumn model created for the reinforced concrete shear wall in this example. spColumn calculates the exact values of strain at each layer of steel (in tension and compression zones) with exact location of the total tension and compression forces leading to exact value for nominal and design strengths (axial and flexural strengths).
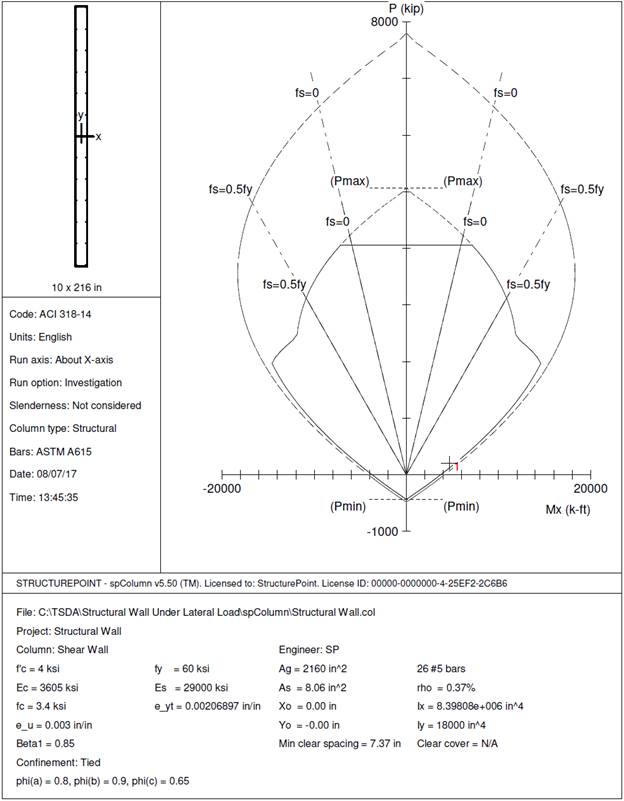
Figure 11 – Shear Wall Interaction Diagram (X-Axis, In-Plane) (spColumn)
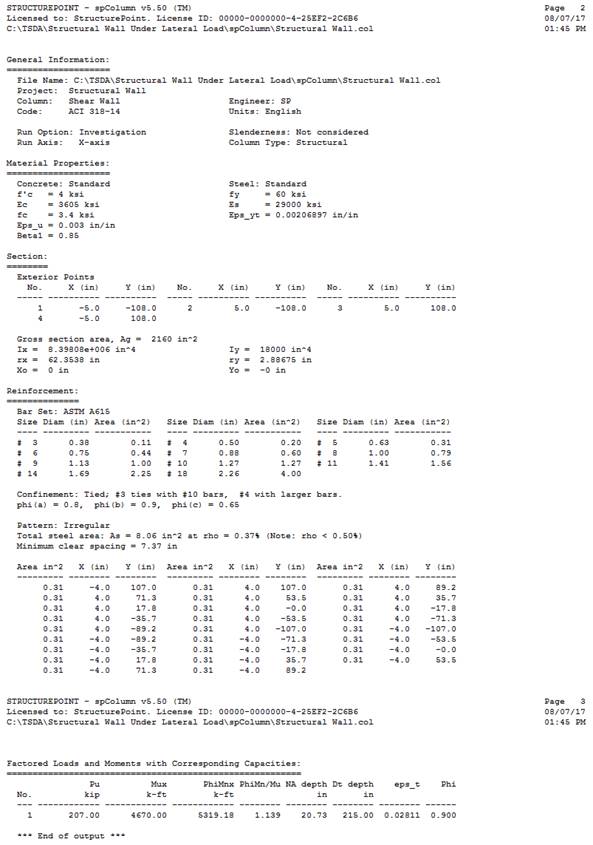
Figure 12 – Load & Moment Capacities Output from spColumn
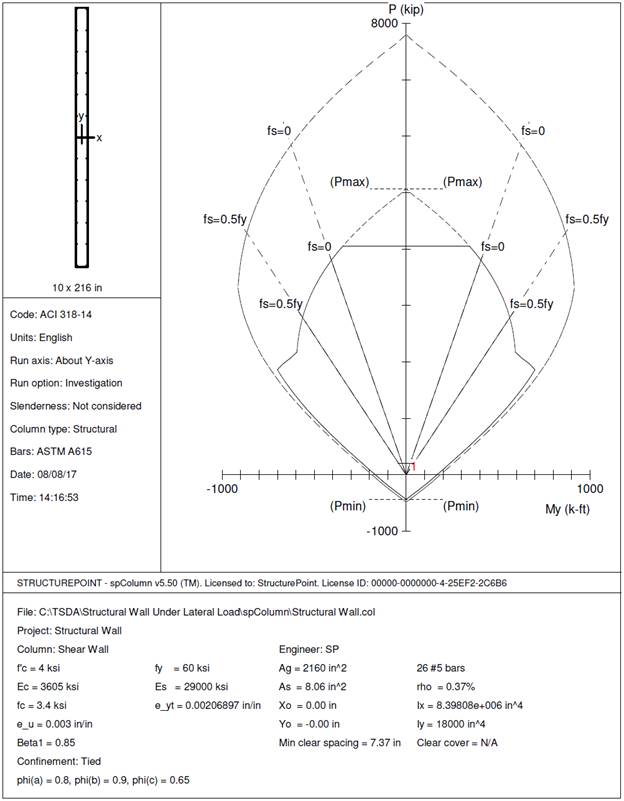
Figure 13 – Shear Wall Interaction Diagram (Y-Axis, Out-of-Plane) (spColumn)
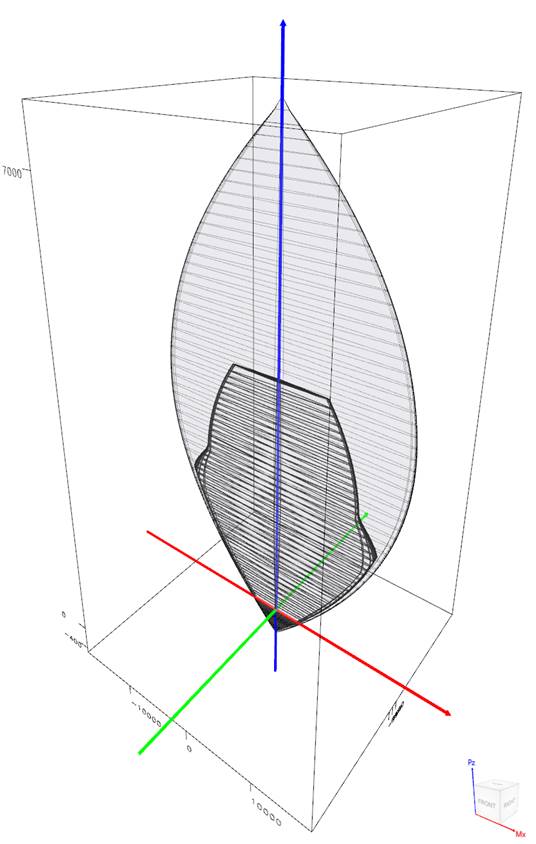
Figure 14 – Wall Section Interaction Diagram – 3D (spColumn)
Using the spColumn results output, further comparison can be made for the shear wall capacity parameters as summarized below:
|
Table 2 – Comparison of Flexural Capacity Based on Method of Solution |
||||
|
Solution Method |
c, in. |
εt, in./in. |
ϕMn, kip-ft |
(Calculated/Exact)Capacity |
|
Hand |
19.80 |
--- |
4,670 |
88% |
|
Reference |
19.80 |
--- |
4,670 |
88% |
|
--- |
--- |
5,344* |
100% |
|
|
20.73 |
0.02811 |
5,319 |
100% |
|
|
* Calculated from spWall plate reinforcement by summing the capacity of each element along the wall cross-section |
||||
The last column in the table above compares the hand calculated capacity estimated by approximate methods to the exact values generated by spWall and spColumn. The impact of simplifying assumptions is illustrated in the figure below showing the value of incorporating the exact value and location of steel and concrete strains and forces.
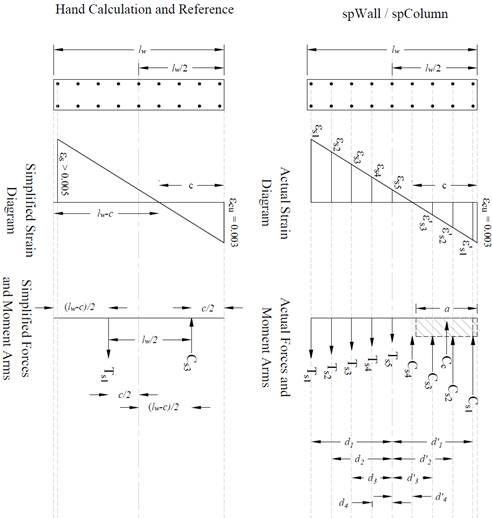
Figure 15 – Strains, Forces, and Moment Arms for simplified and Actual Methods