The analysis of the reinforced concrete section performed by spColumn conforms to the provisions of the Strength Design Method and Unified Design Provisions with all conditions of strength satisfying the applicable conditions of equilibrium and strain compatibility.
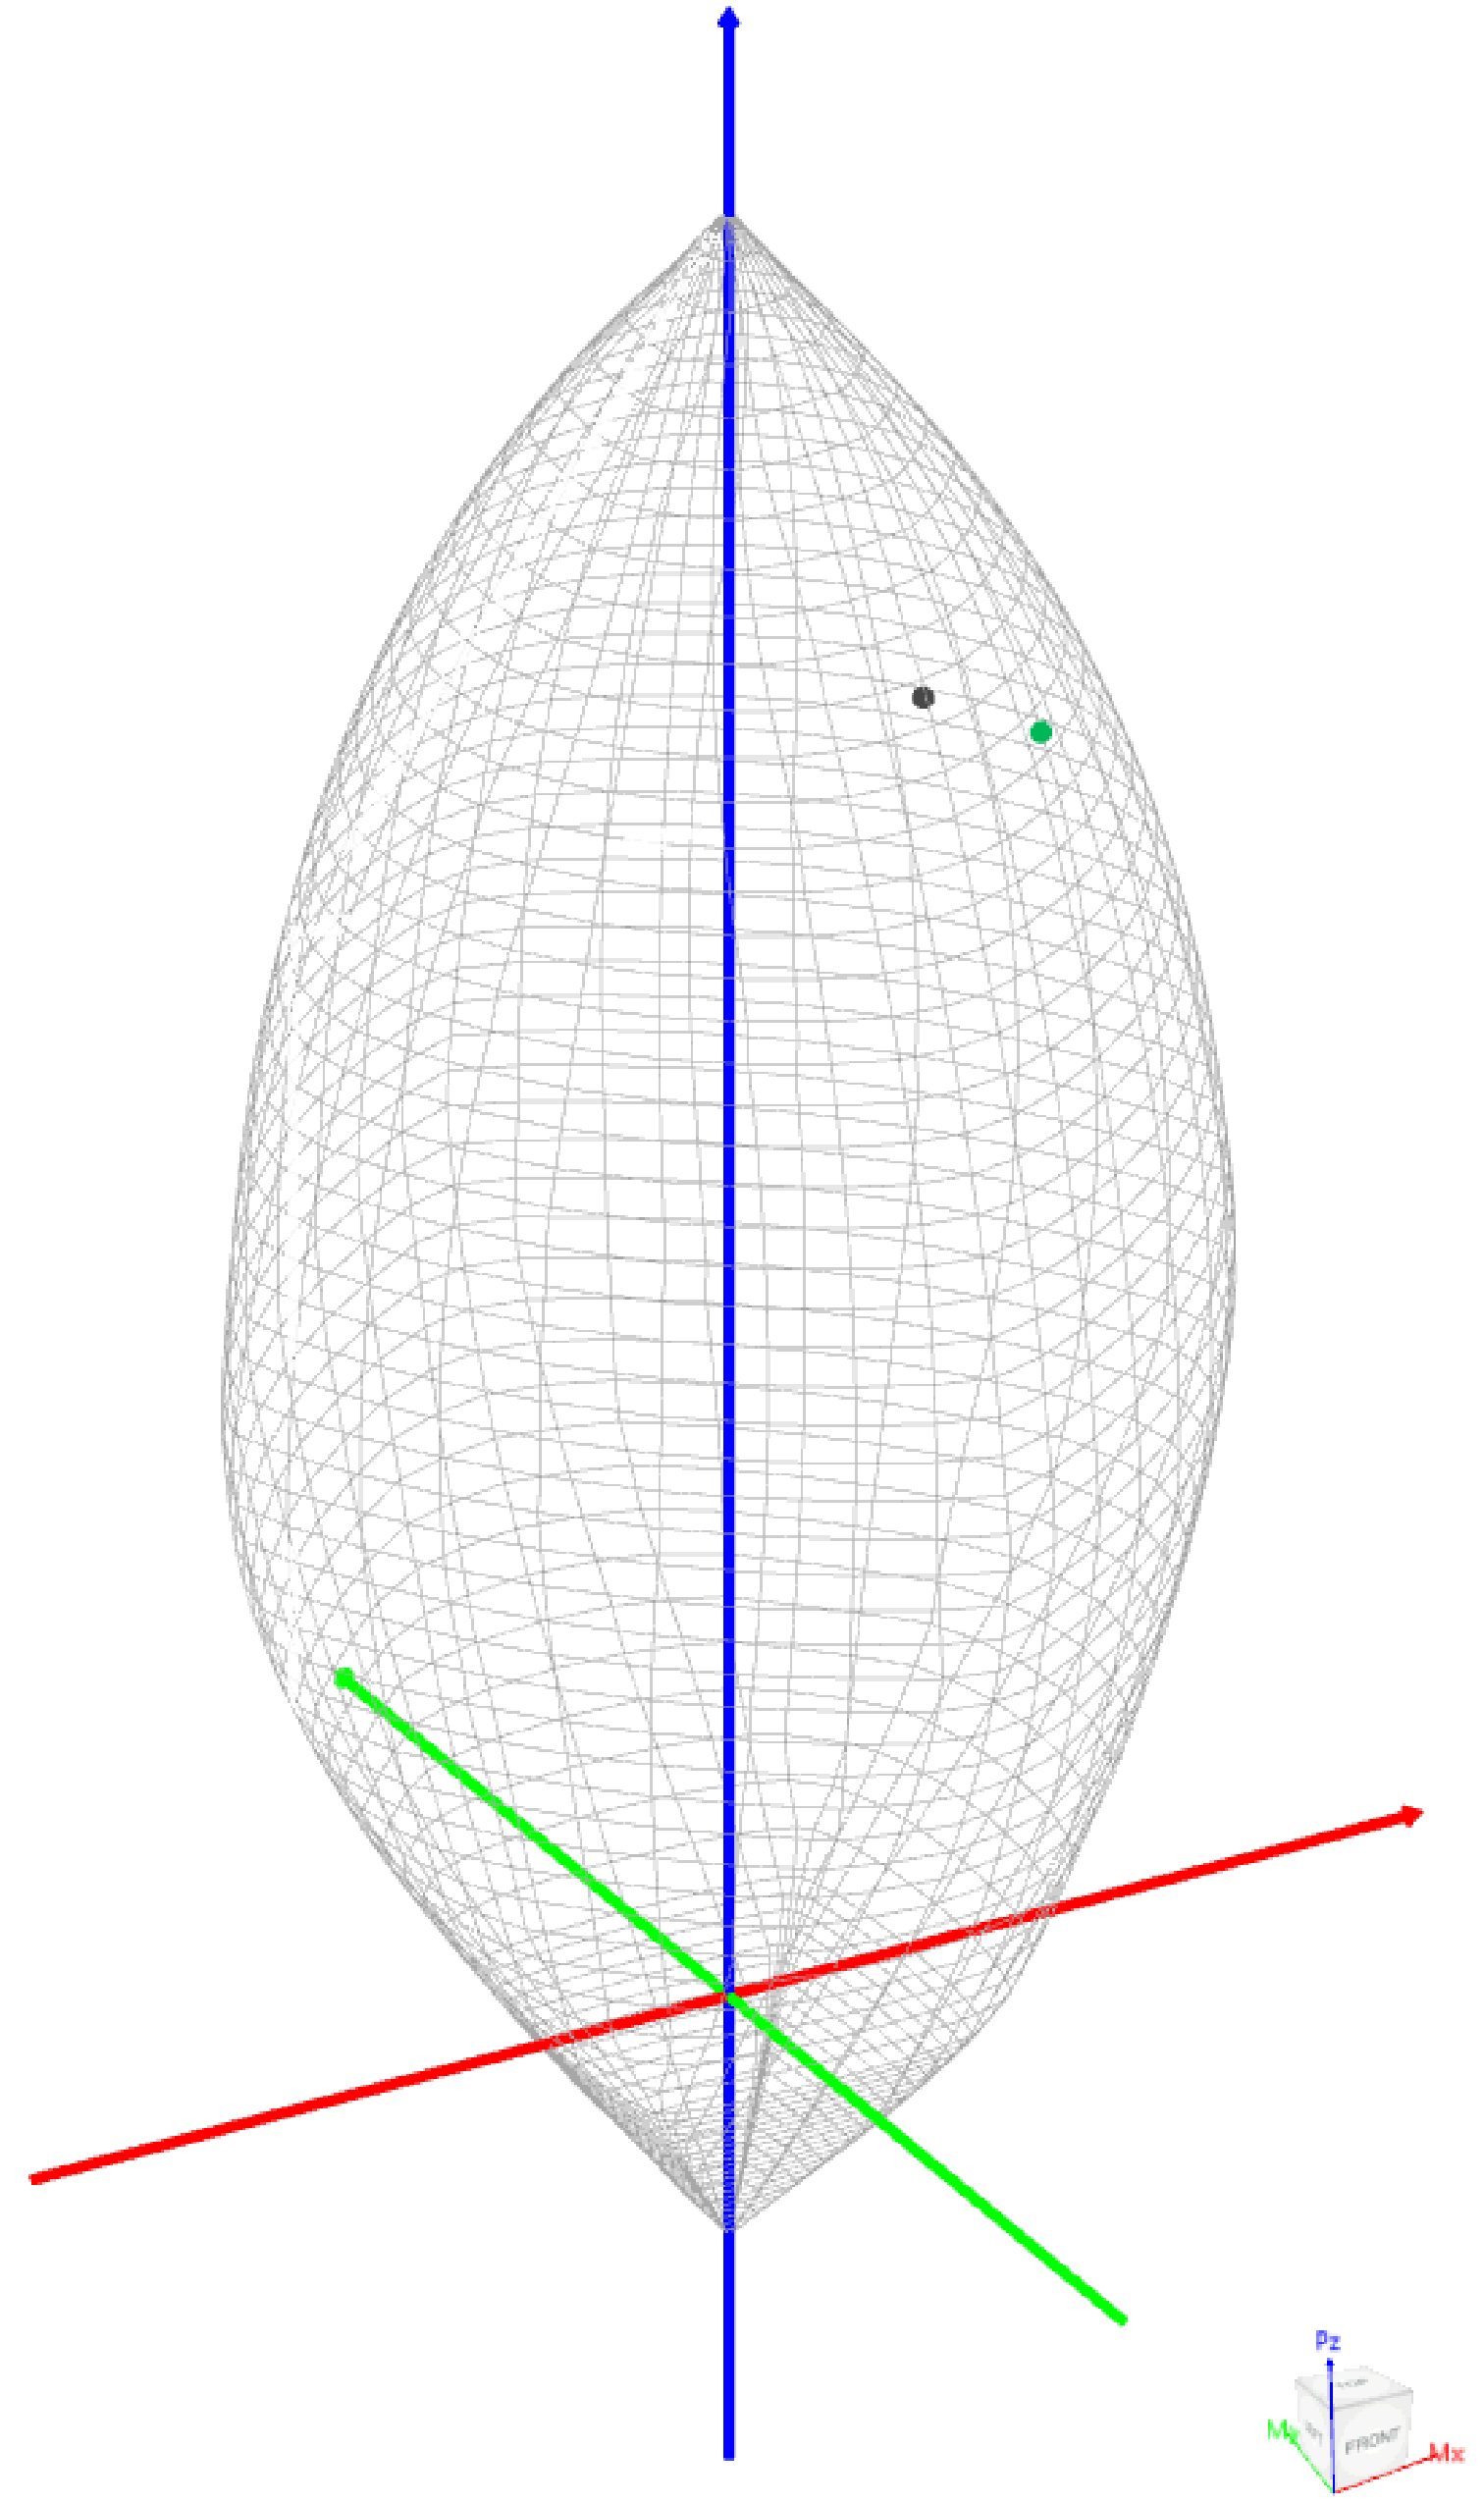
In most building design calculations, such as the examples shown for flat plate or flat slab concrete floor systems, all building columns may be subjected to biaxial bending (Mx and My) due to lateral forces and unbalanced moments from both directions of analysis. This requires an evaluation of the column P-Mx-My interaction diagram (3D failure surface) in two directions simultaneously (axial force interaction with biaxial bending).
This example shows a detailed comparison between exact hand solution, spColumn software results and the most commonly used approximate methods needed to design reinforced concrete column subjected to a combined axial force and biaxial bending moments. The approximate methods provide conservative solution in most cases and require tedious calculations to obtain the equivalent uniaxial capacities and other parameters. Additionally, performing exact solution manually to design column section subjected to a combined axial force and biaxial bending moments is tedious and challenging for engineers and the use of a computer aid can save time and eliminate errors.
StucturePoint’s spColumn program can, quickly, simply and accurately design and generate the three-dimensional failure surface (interaction diagram) for all commonly encountered column, beam or wall sections in addition to highly complex and irregular cross-sections.
Figure 25 - Interaction Diagram in Two Directions (Biaxial) (spColumn)
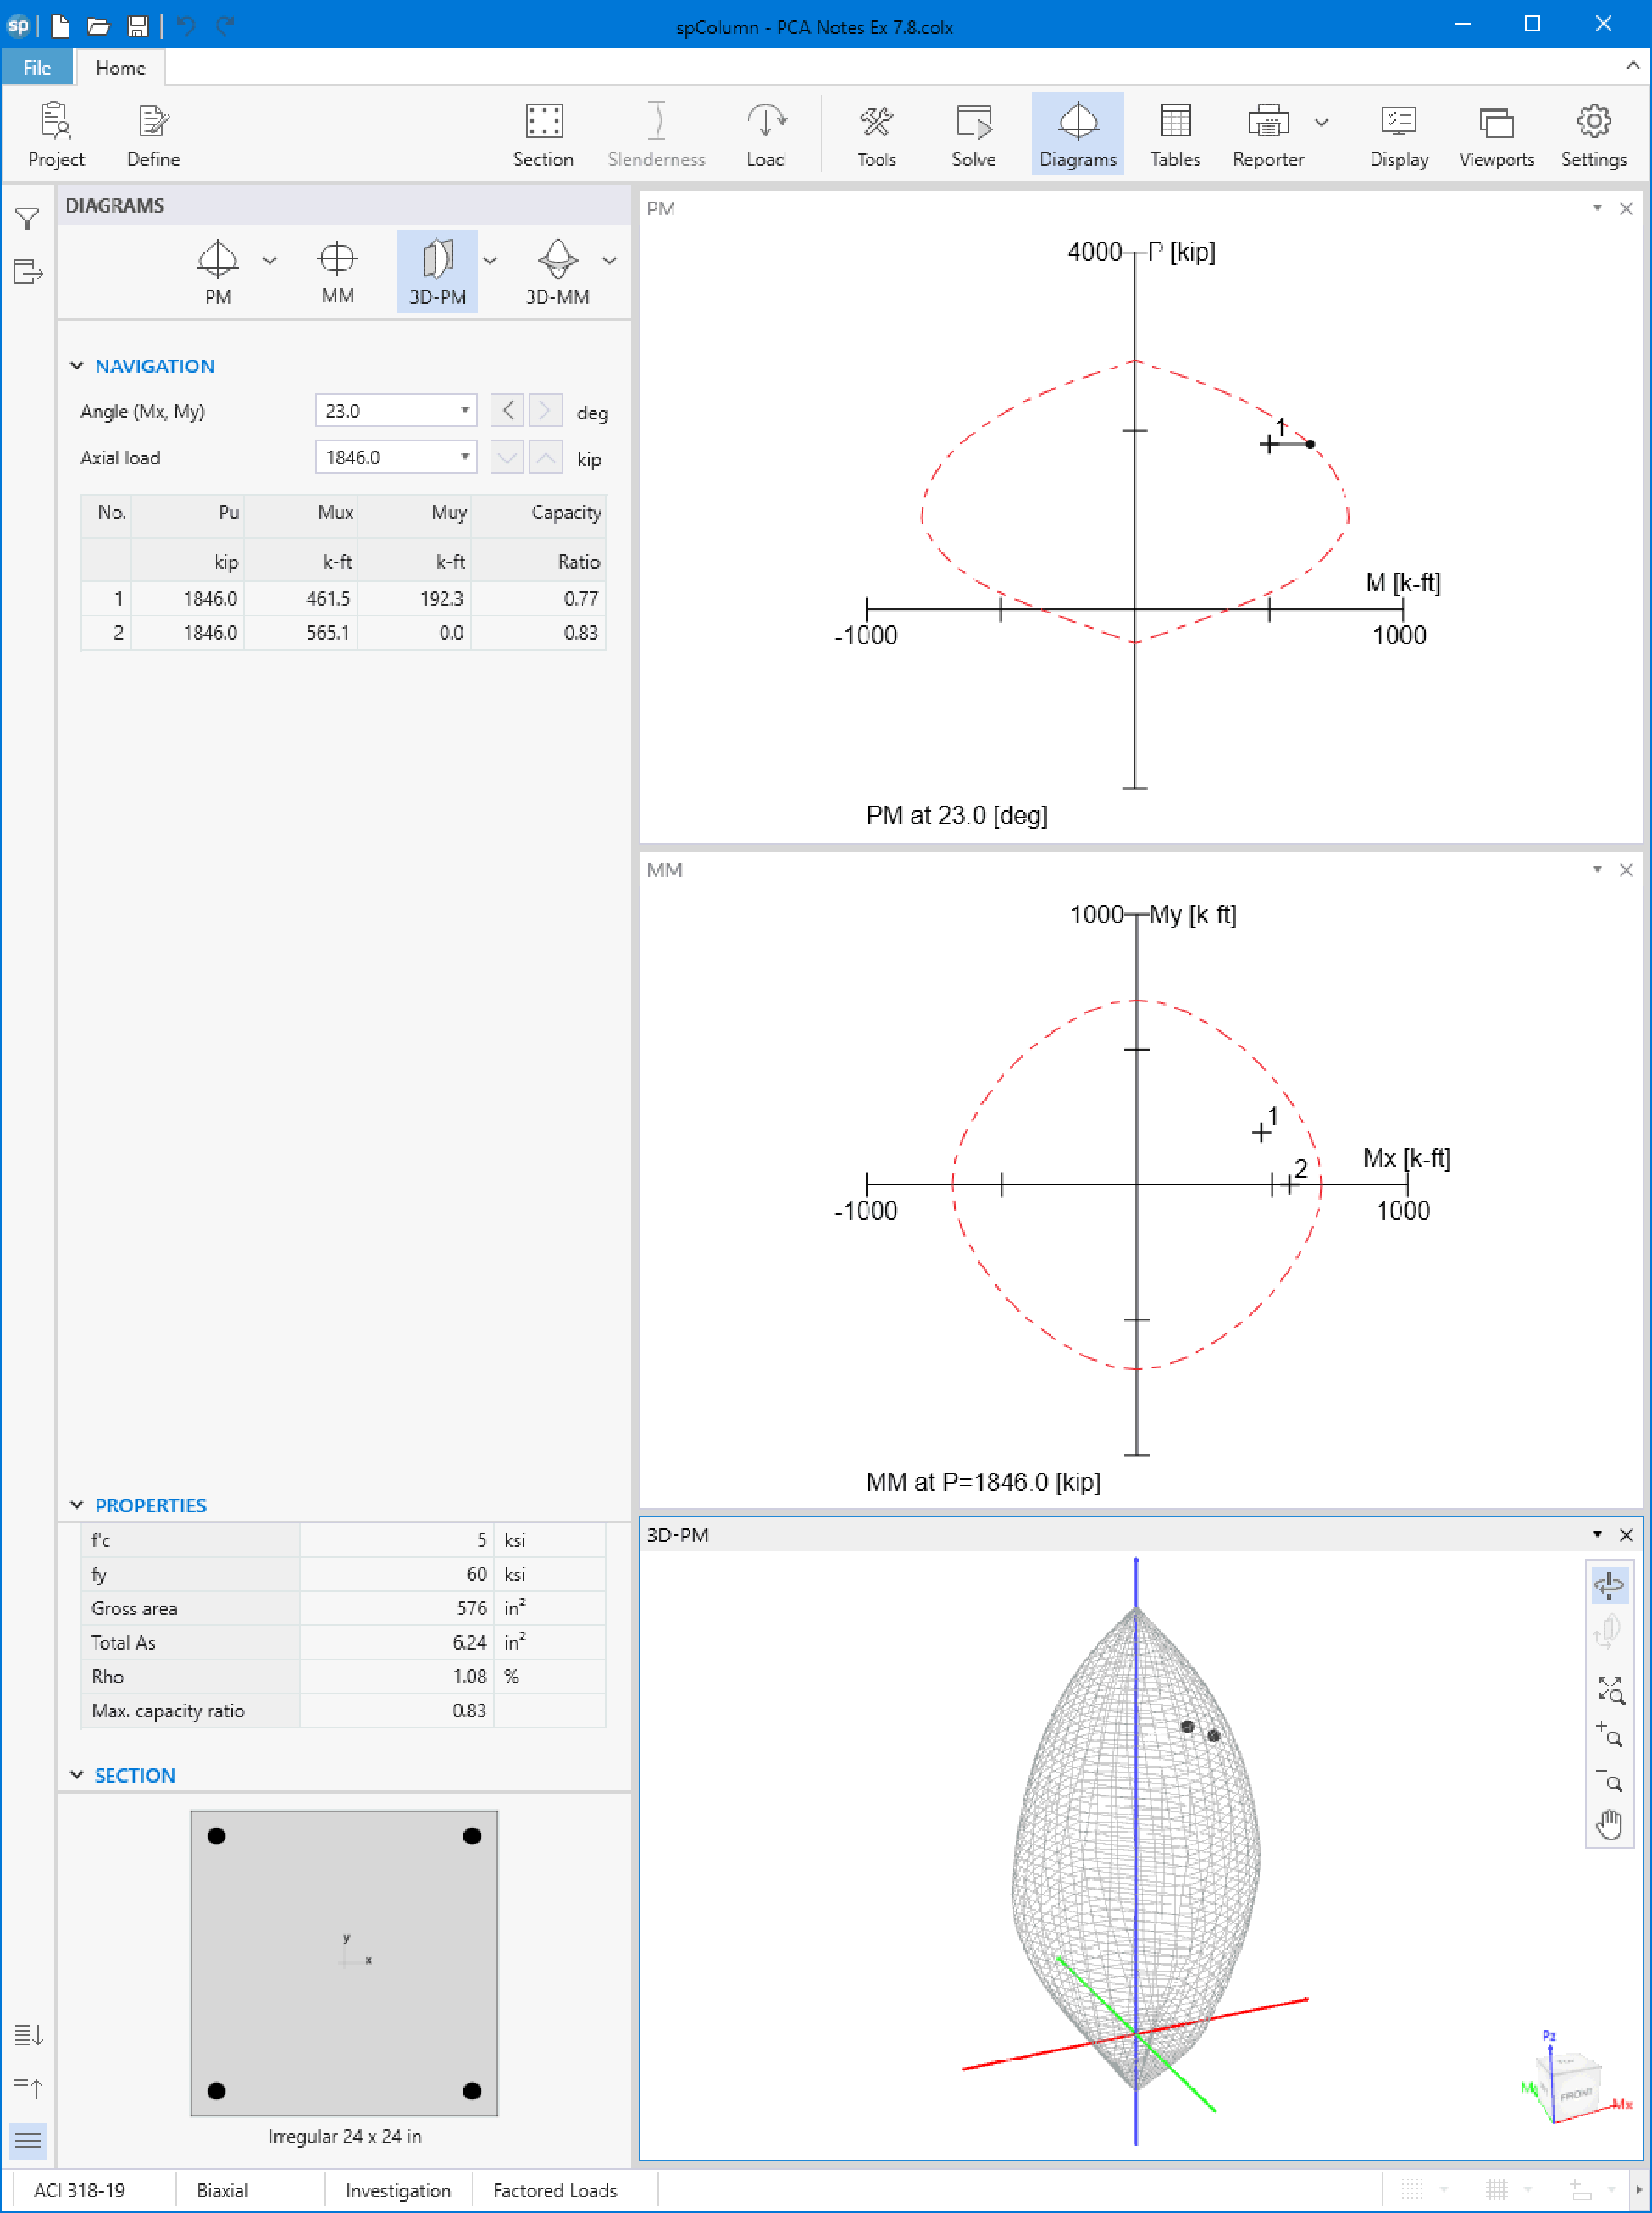
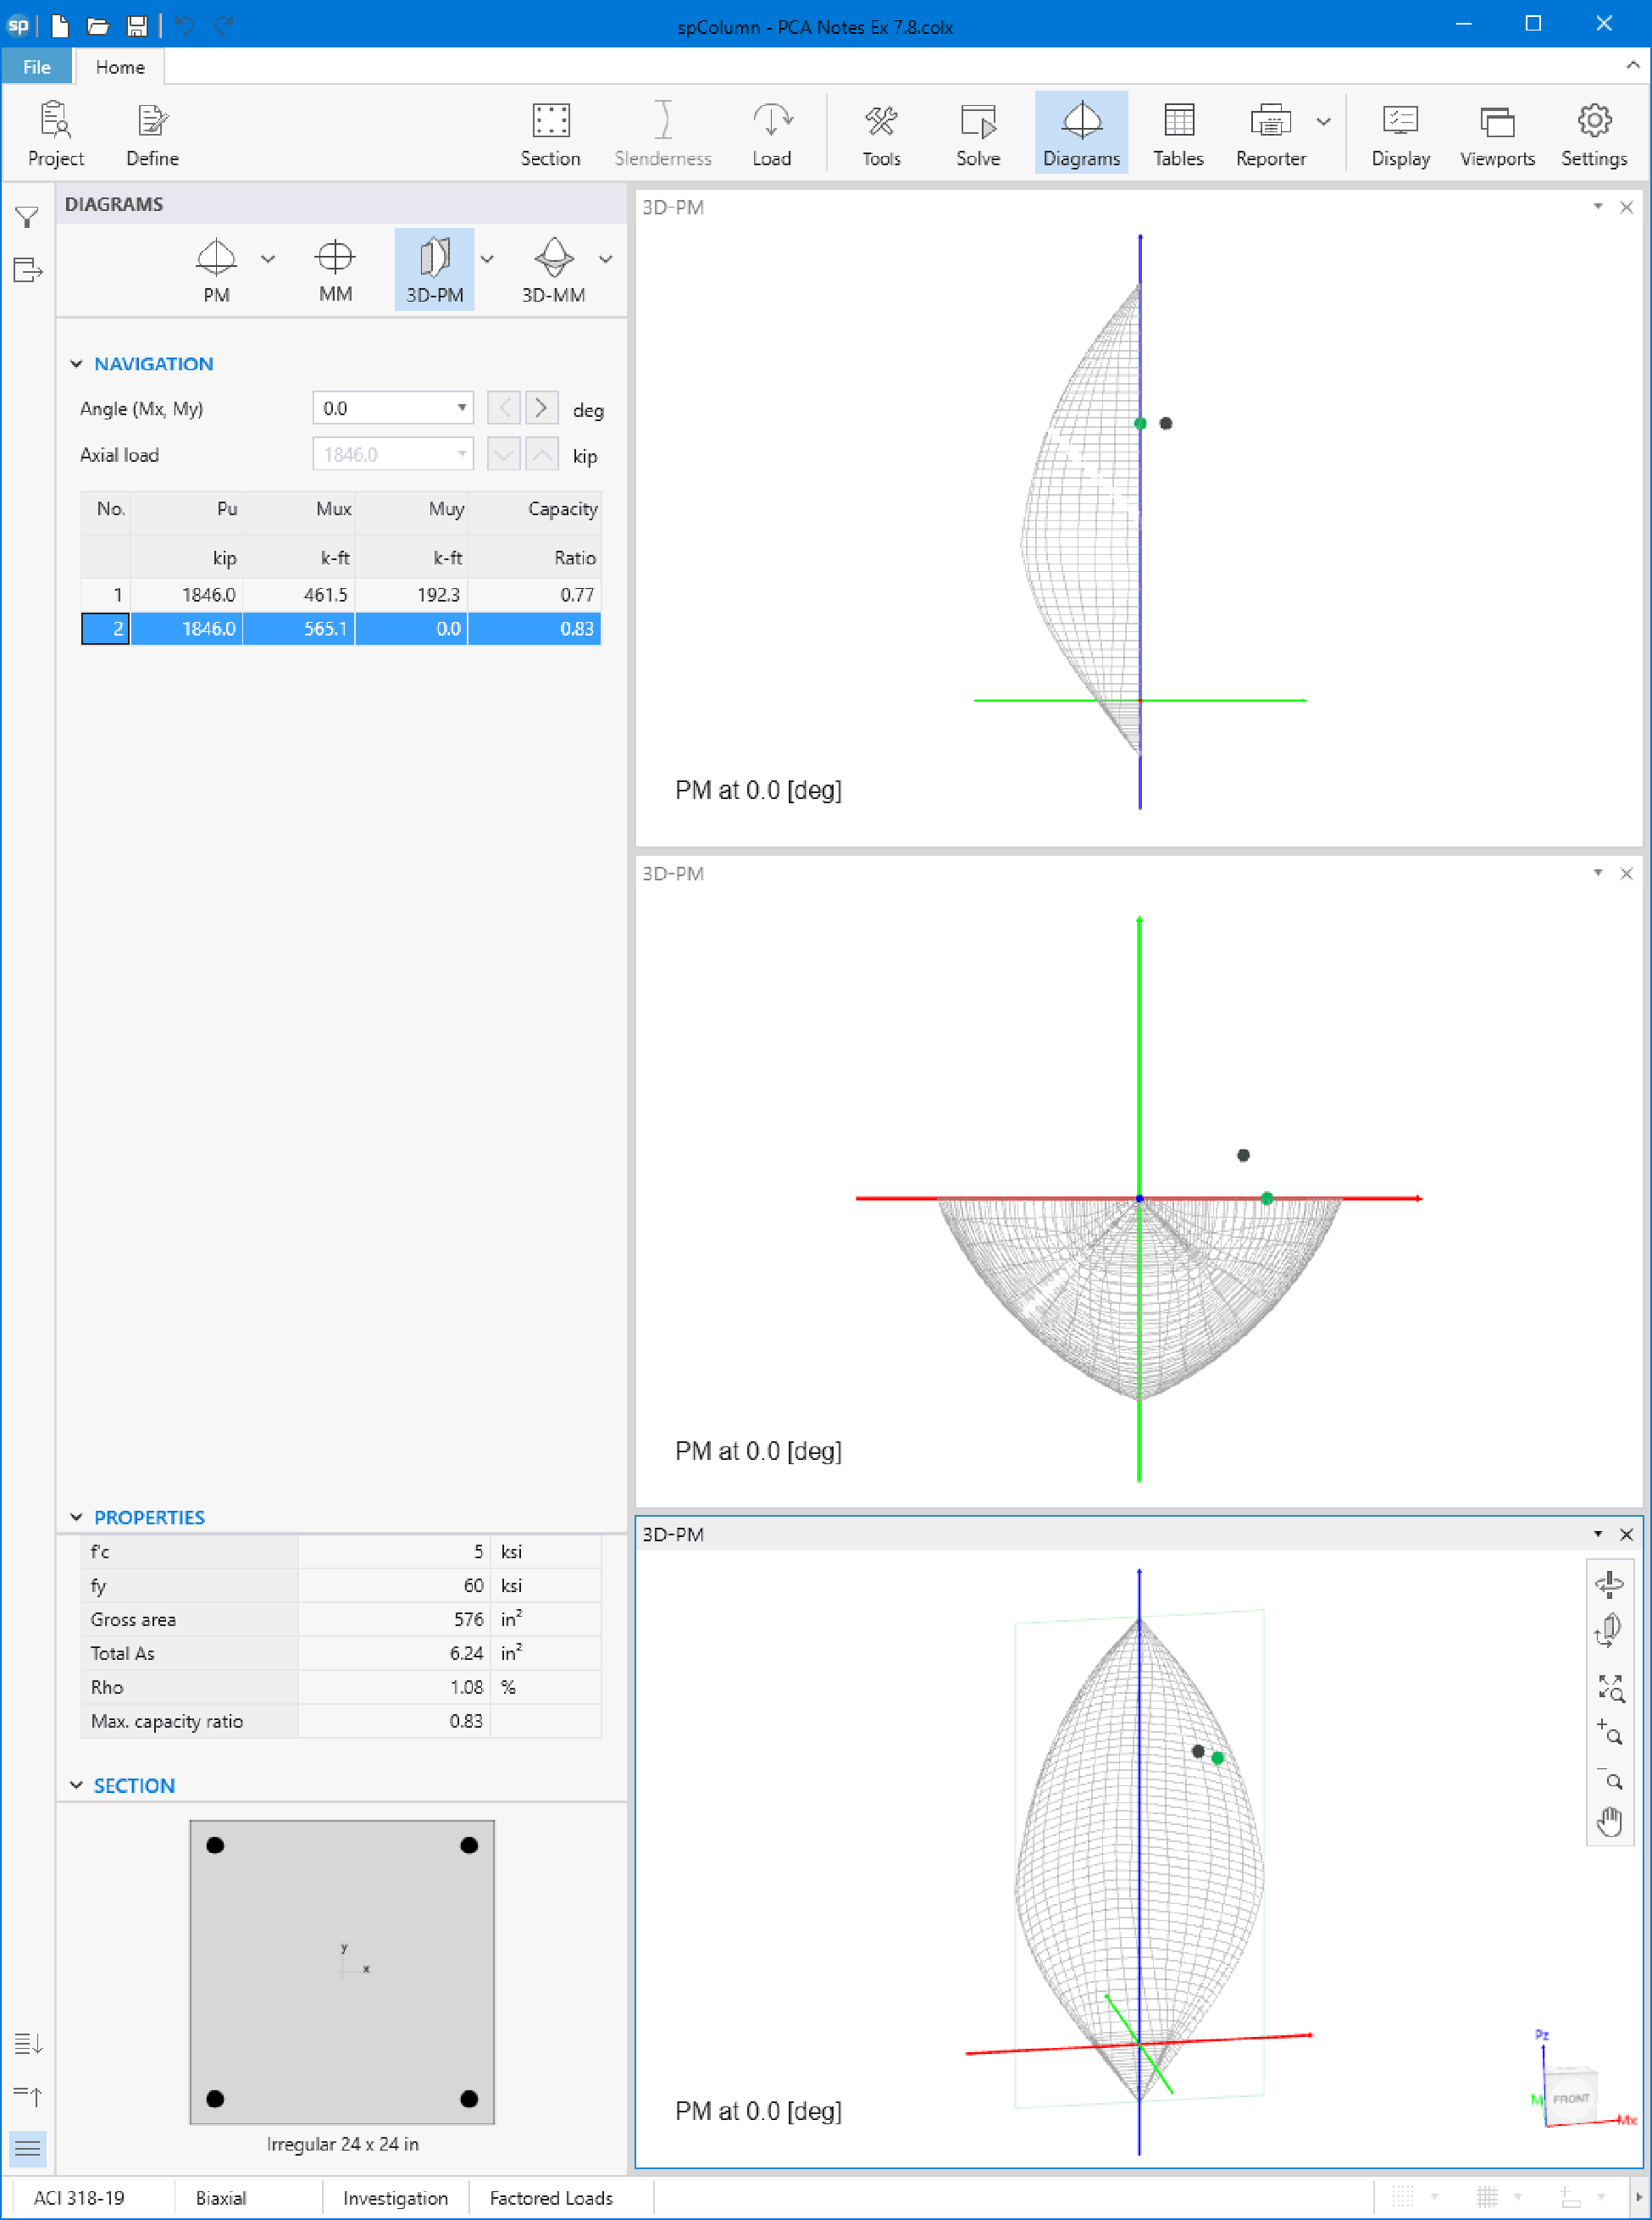
The spColumn “Diagrams” module is a powerful tool especially for investigating interaction diagrams (failure surfaces) for columns and walls sections subjected to a combined axial force and biaxial bending moments. The module allows the user to view and analyze 2D interaction diagrams and contours along with 3D failure surfaces in a multi viewport environment.
"Figure 26 - Diagrams Module (spColumn)" shows three views of:
1. P-M interaction diagram cut at angle of 23º
2. Mx-My interaction diagram cut at axial load of 1846.0 kip in compression
3. A 3D failure surface (interaction diagram) showing the points calculated in this example.
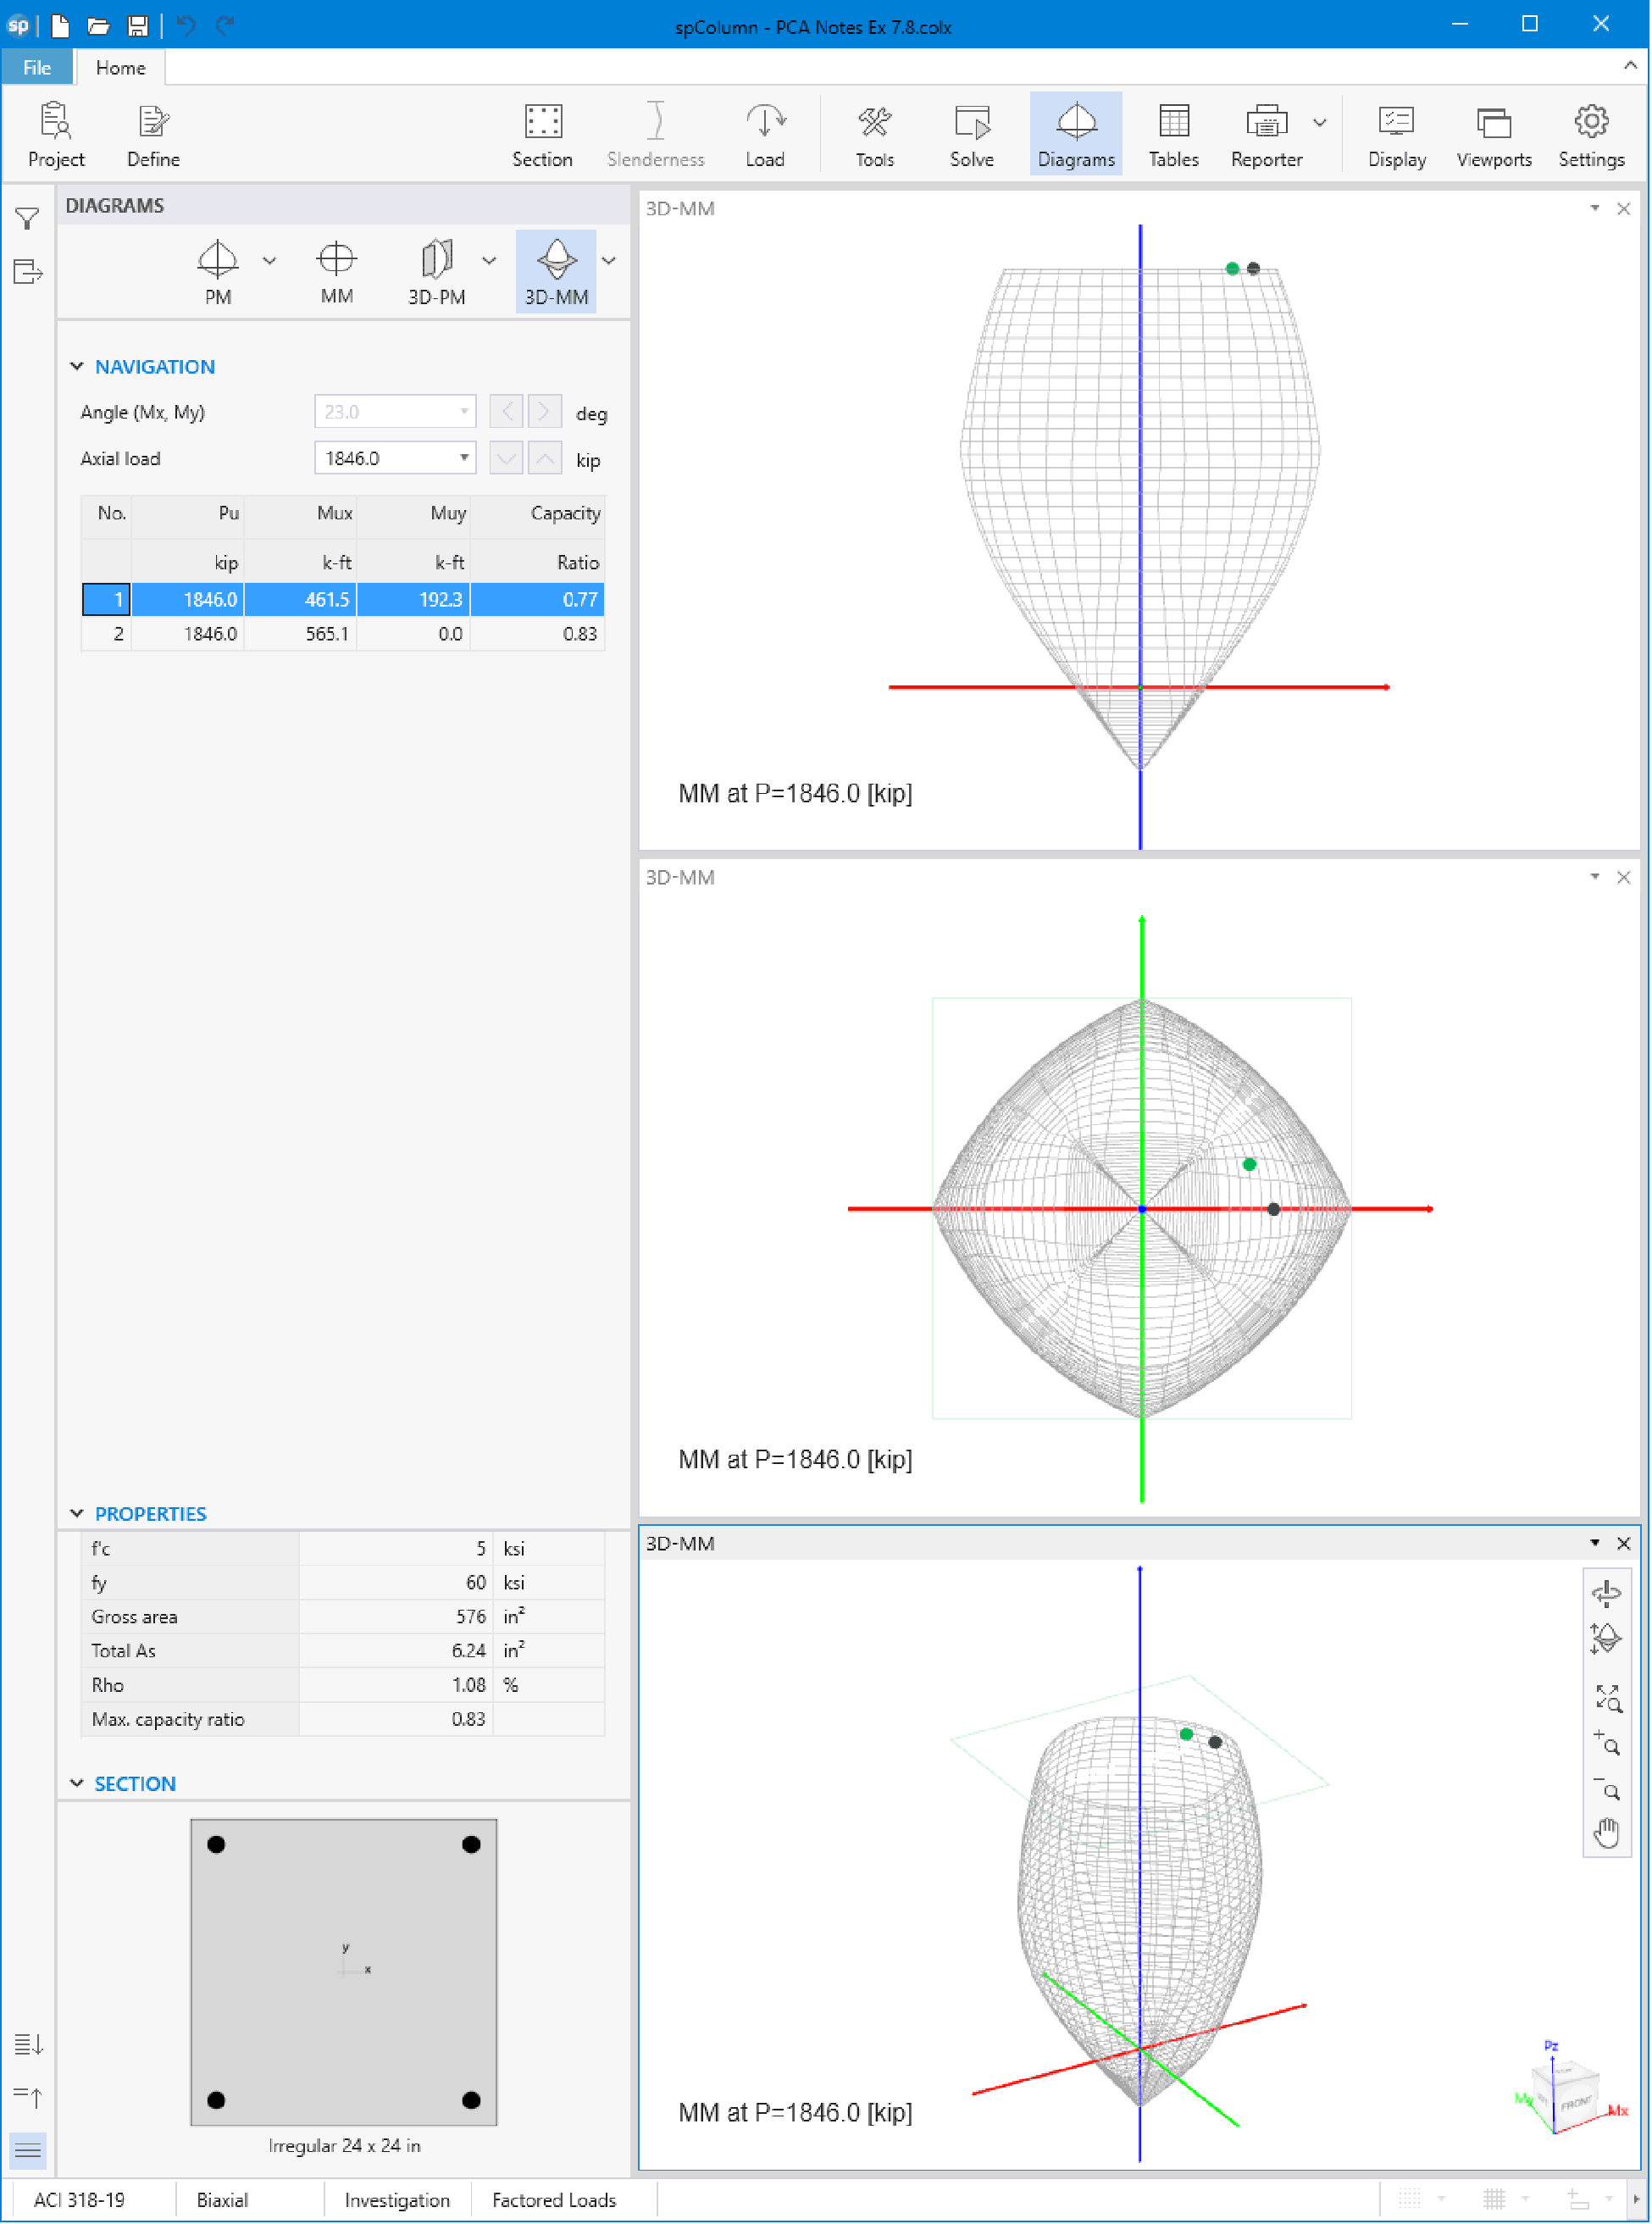
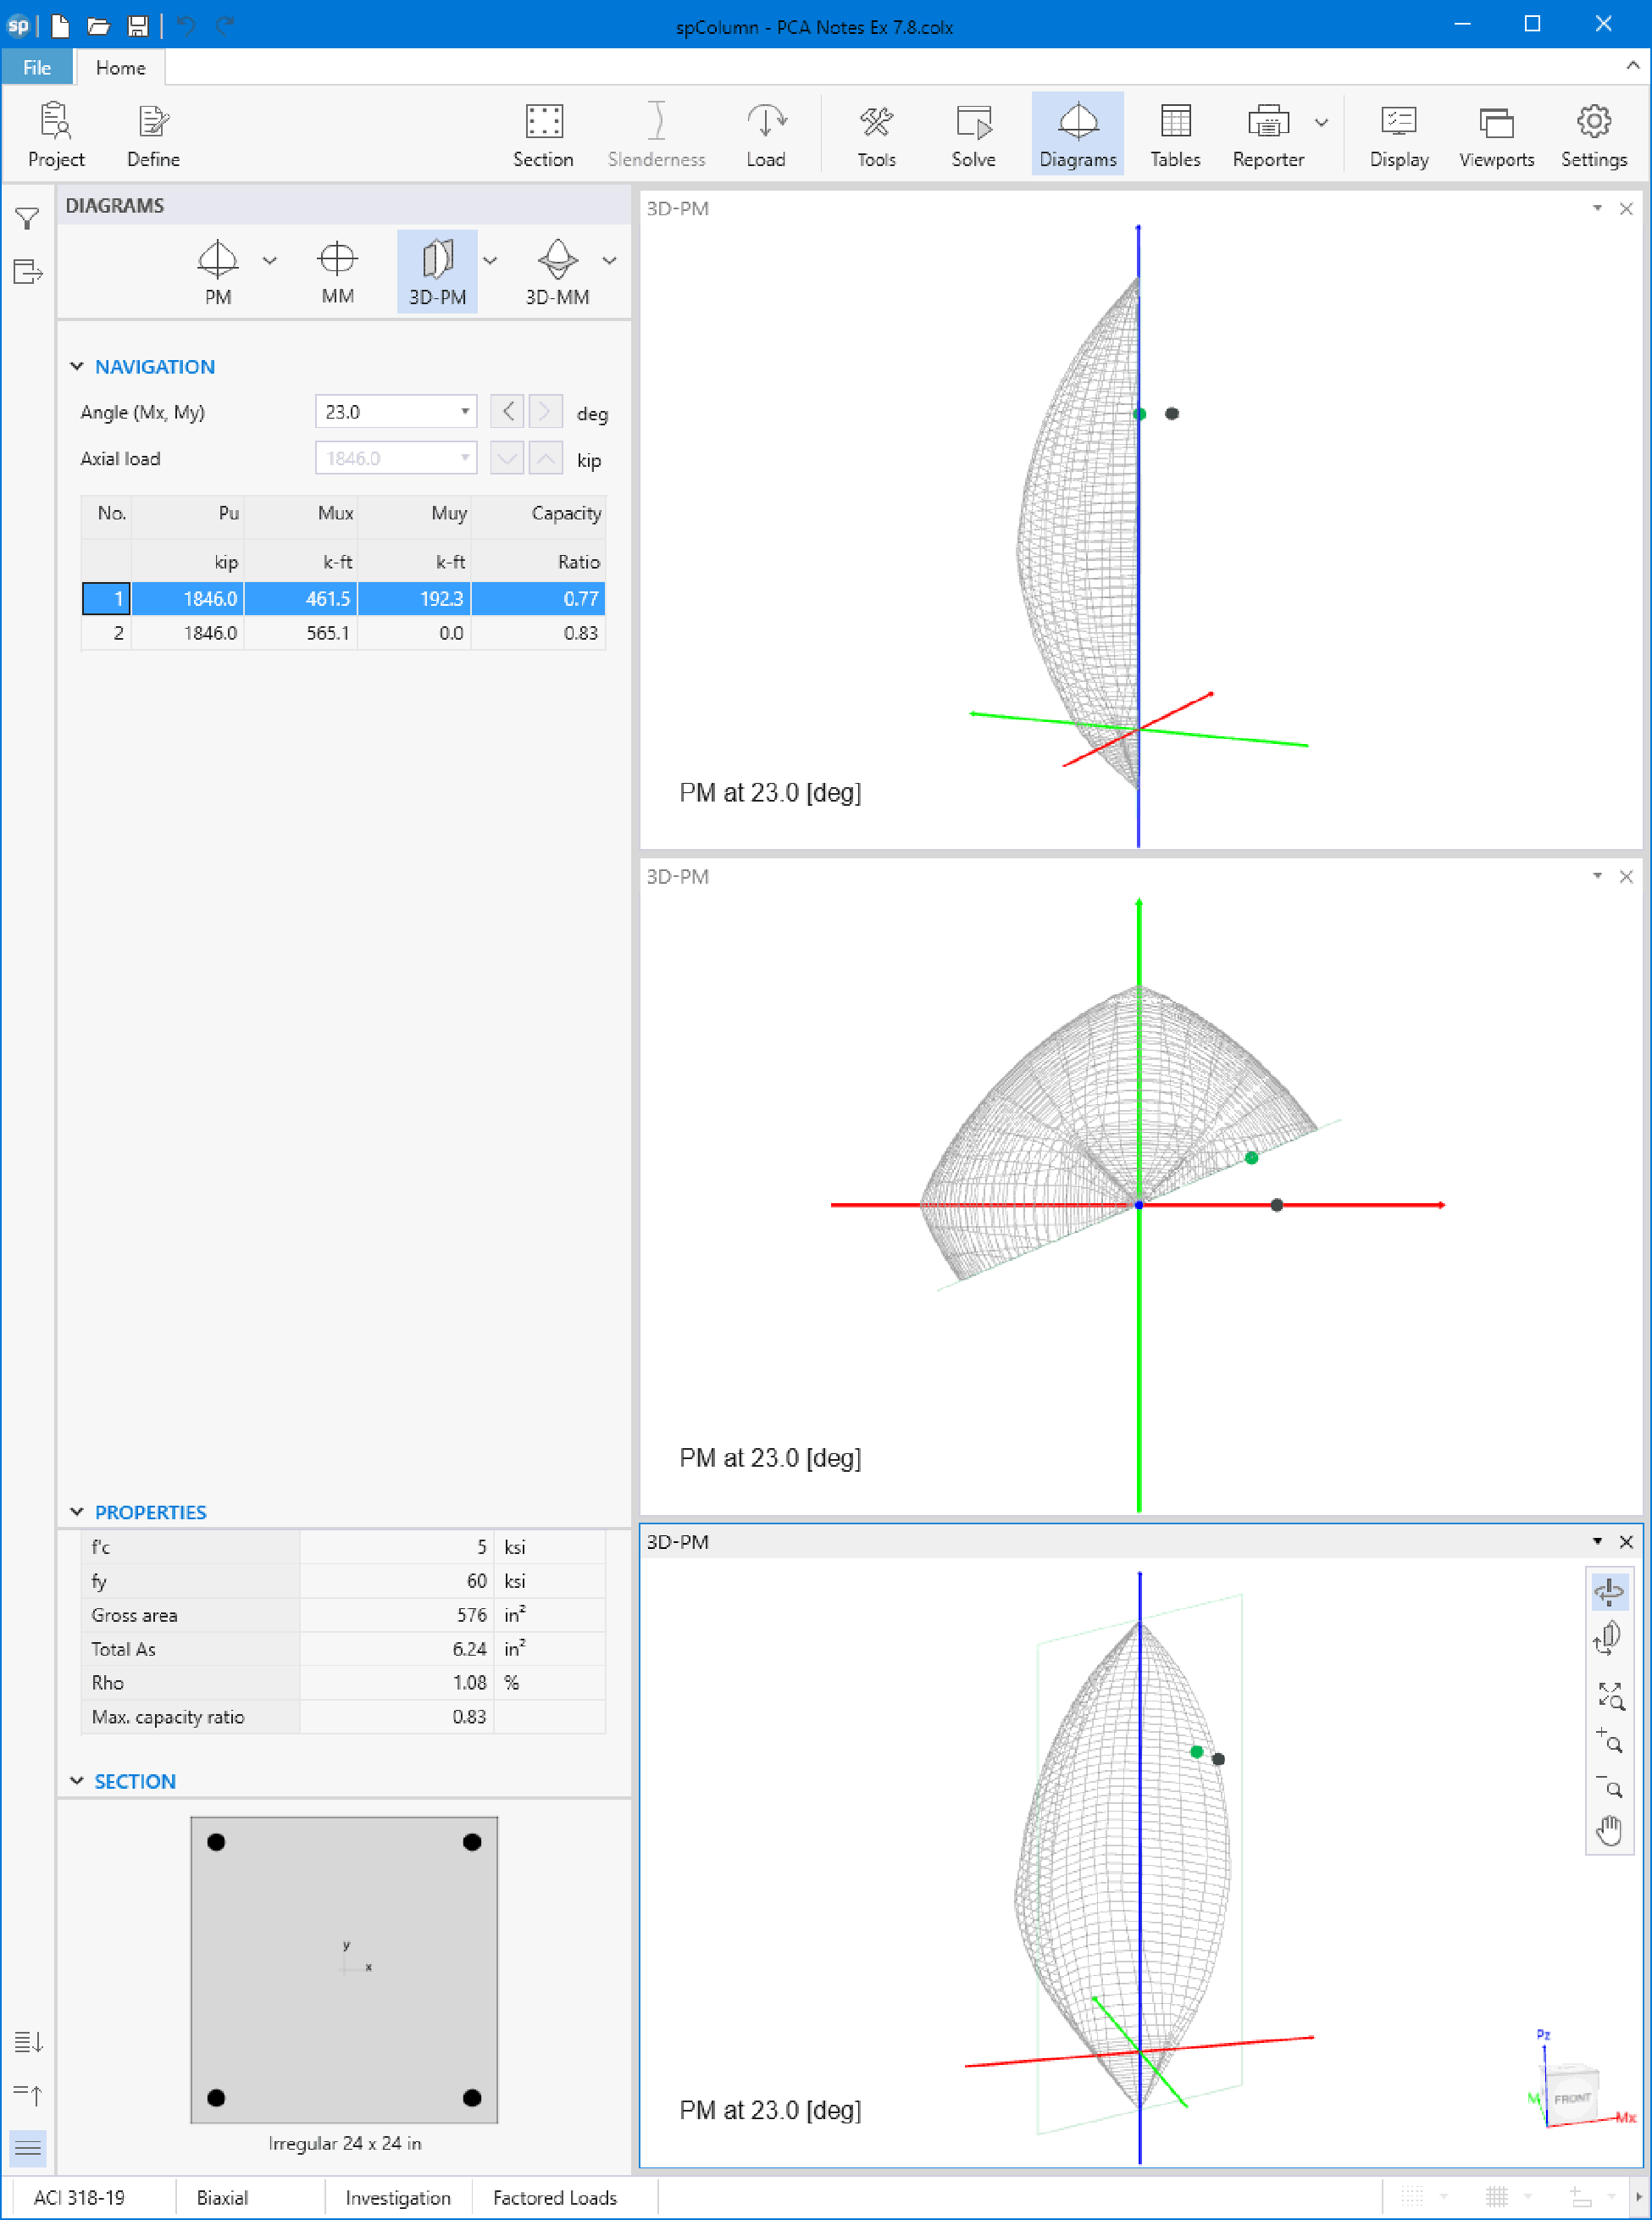
"Figure 27 - 3D Visualization of Failure Surface with a Horizontal Plane Cut a P = 1846.0 kip (spColumn)" and "Figure 28 - 3D Visualization of Failure Surface with a Vertical Plane Cut at 23º (spColumn)" show 3D visualization of failure surface with a horizontal and vertical plane cut, respectively.
Figure 26 - Diagrams Module (spColumn)
Figure 27 - 3D Visualization of Failure Surface with a Horizontal Plane Cut a P = 1846.0 kip (spColumn)
Figure 28 - 3D Visualization of Failure Surface with a Vertical Plane Cut at 23º (spColumn)
Figure 29 - 3D Visualization of Failure Surface with a Vertical Plane Cut at 0º (spColumn)
