4. Design Results Comparison and Conclusions
Table 1 - Comparison of Precast Wall Panel Analysis and Design Results | |||
Solution | Pf (kN) | As,vertical (mm2) | As,horizontal (mm2) |
Hand | 375 | 525 | 700 |
Reference | 375 | 525 | 700 |
spWall | 375 | 525 | 700 |
The results of all the hand calculations and the reference used illustrated above are in precise agreement with the automated exact results obtained from the spWall program.
For investigation purposes, the spWall model was revised to apply a line load equals to the axial resistance of the concrete wall (Pf = Pr = 2,821 kN/m). It was noticed that the minimum reinforcement still governs.
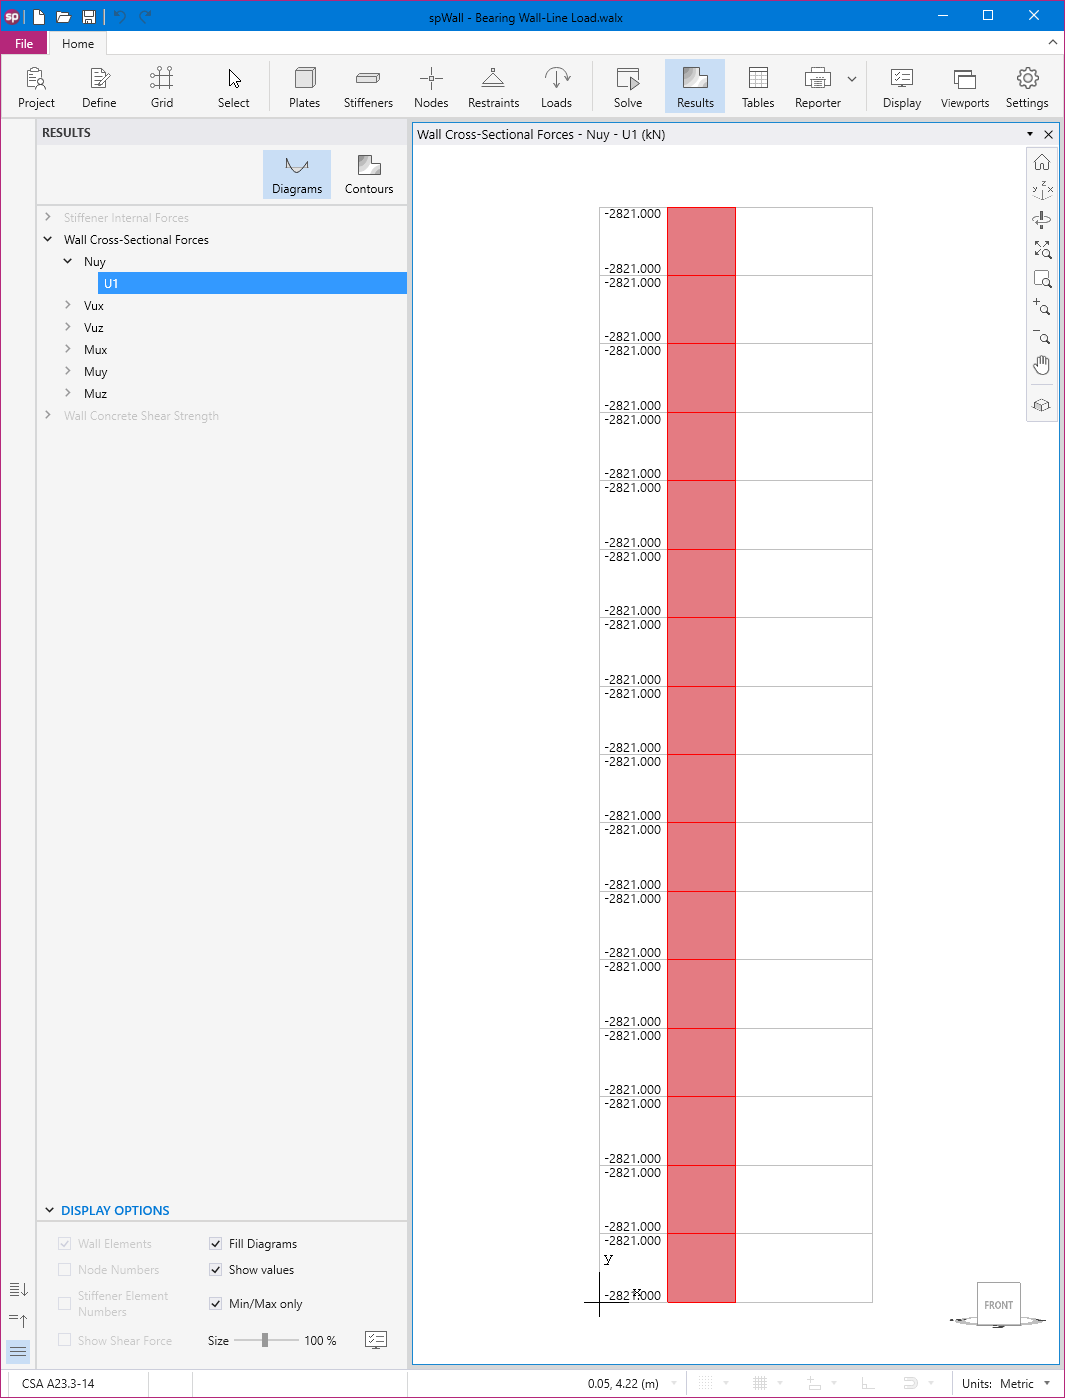
Figure 9 - Reinforced Concrete Bearing Wall Axial Load Diagram (Pf = Pr = 2821 kN/m) (spWall)
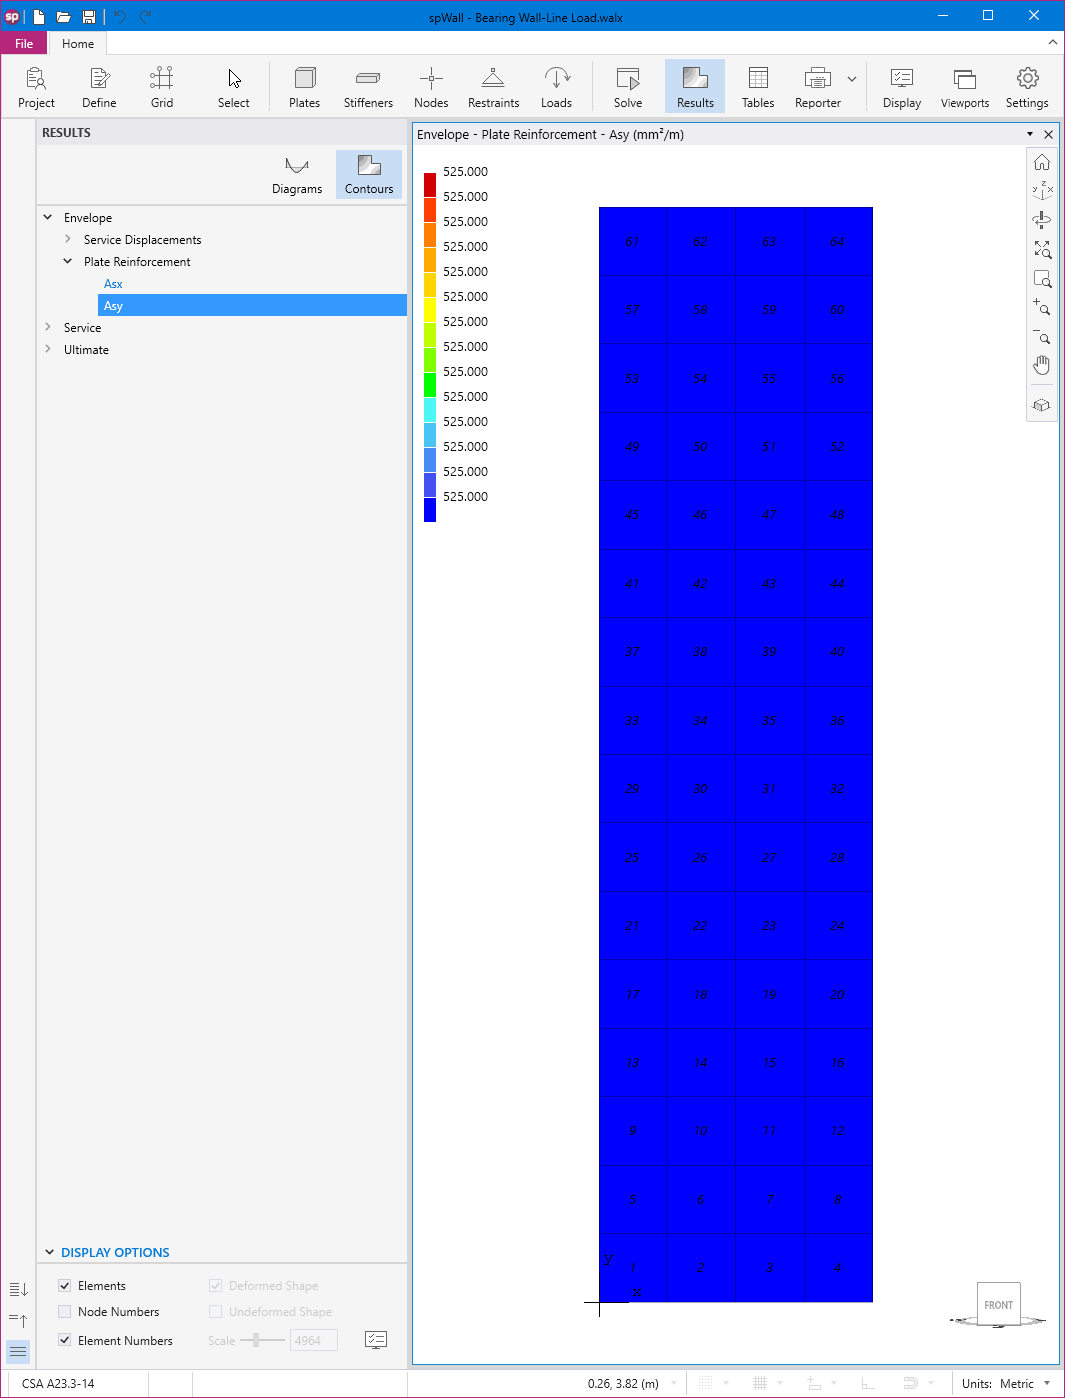
Figure 10 - Reinforced Concrete Bearing Wall Required Vertical Reinforcement (Pf = Pr = 2821 kN/m) (spWall)
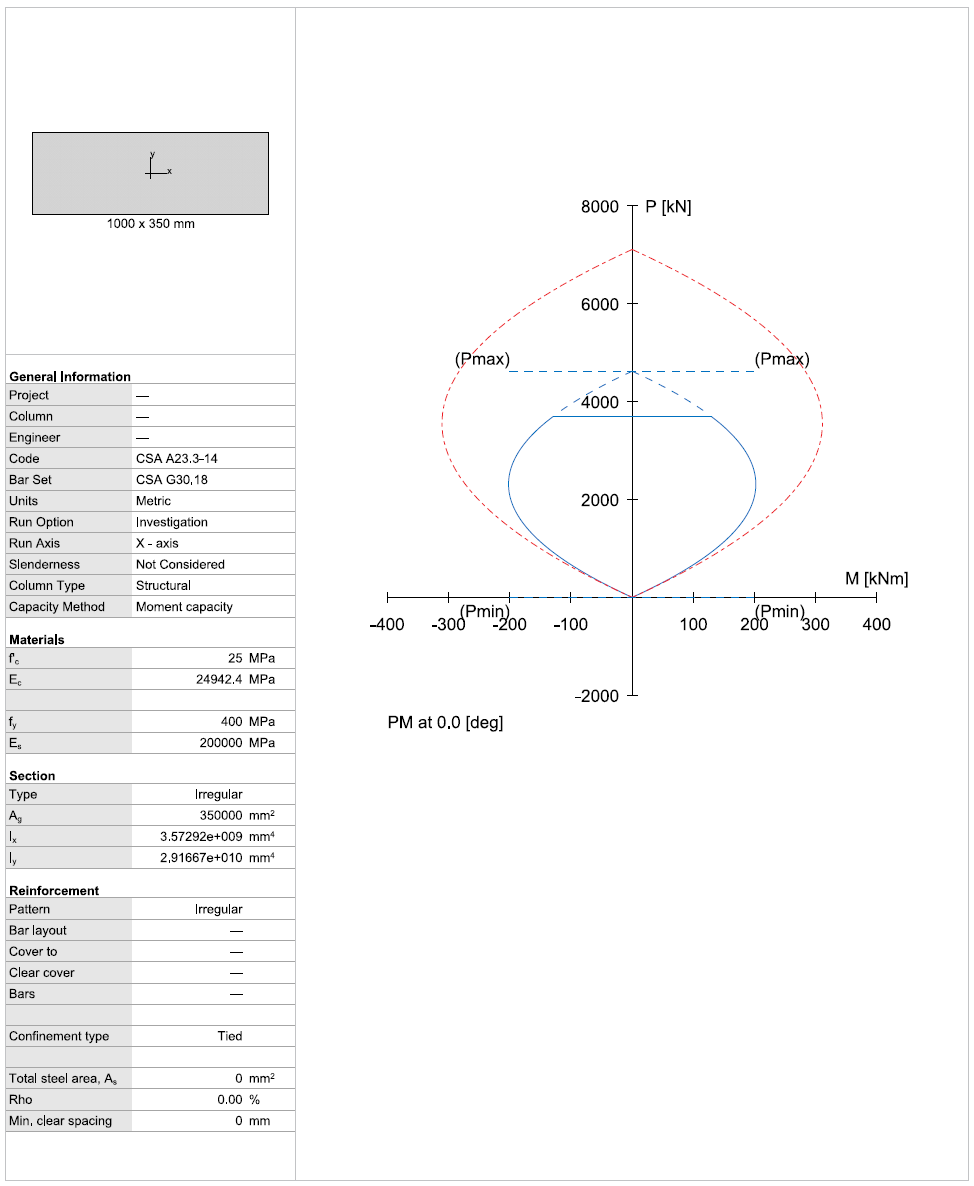
If required, the spColumn program can be used to analyze a model of this concrete wall to arrive at the complete interaction diagram including the maximum allowable compression capacity of this section.