7. Appendix - Commentary on Reinforcement Arrangement Impact on Wall Capacity
In the hand calculations and the reference, a simplified procedure to calculate the nominal flexural strength was used (A.E. Cardenas et al.). In this procedure, several broad assumptions are made to avoid tedious detailed calculations:
• All steel in the tension zone yields in tension.
• All steel in the compression zone yields in compression.
• The tension force acts at mid-depth of the tension zone.
• The total compression force (sum of steel and concrete contributions) acts at mid-depth of the compression zone.
To investigate the shear wall cross section capacity using the interaction diagram method, a model generated by spColumn is made. This approach considers the entire wall section and employs the provisions of the Strength Design Method and Unified Design Provisions with all conditions of strength satisfying the applicable conditions of equilibrium and strain compatibility.
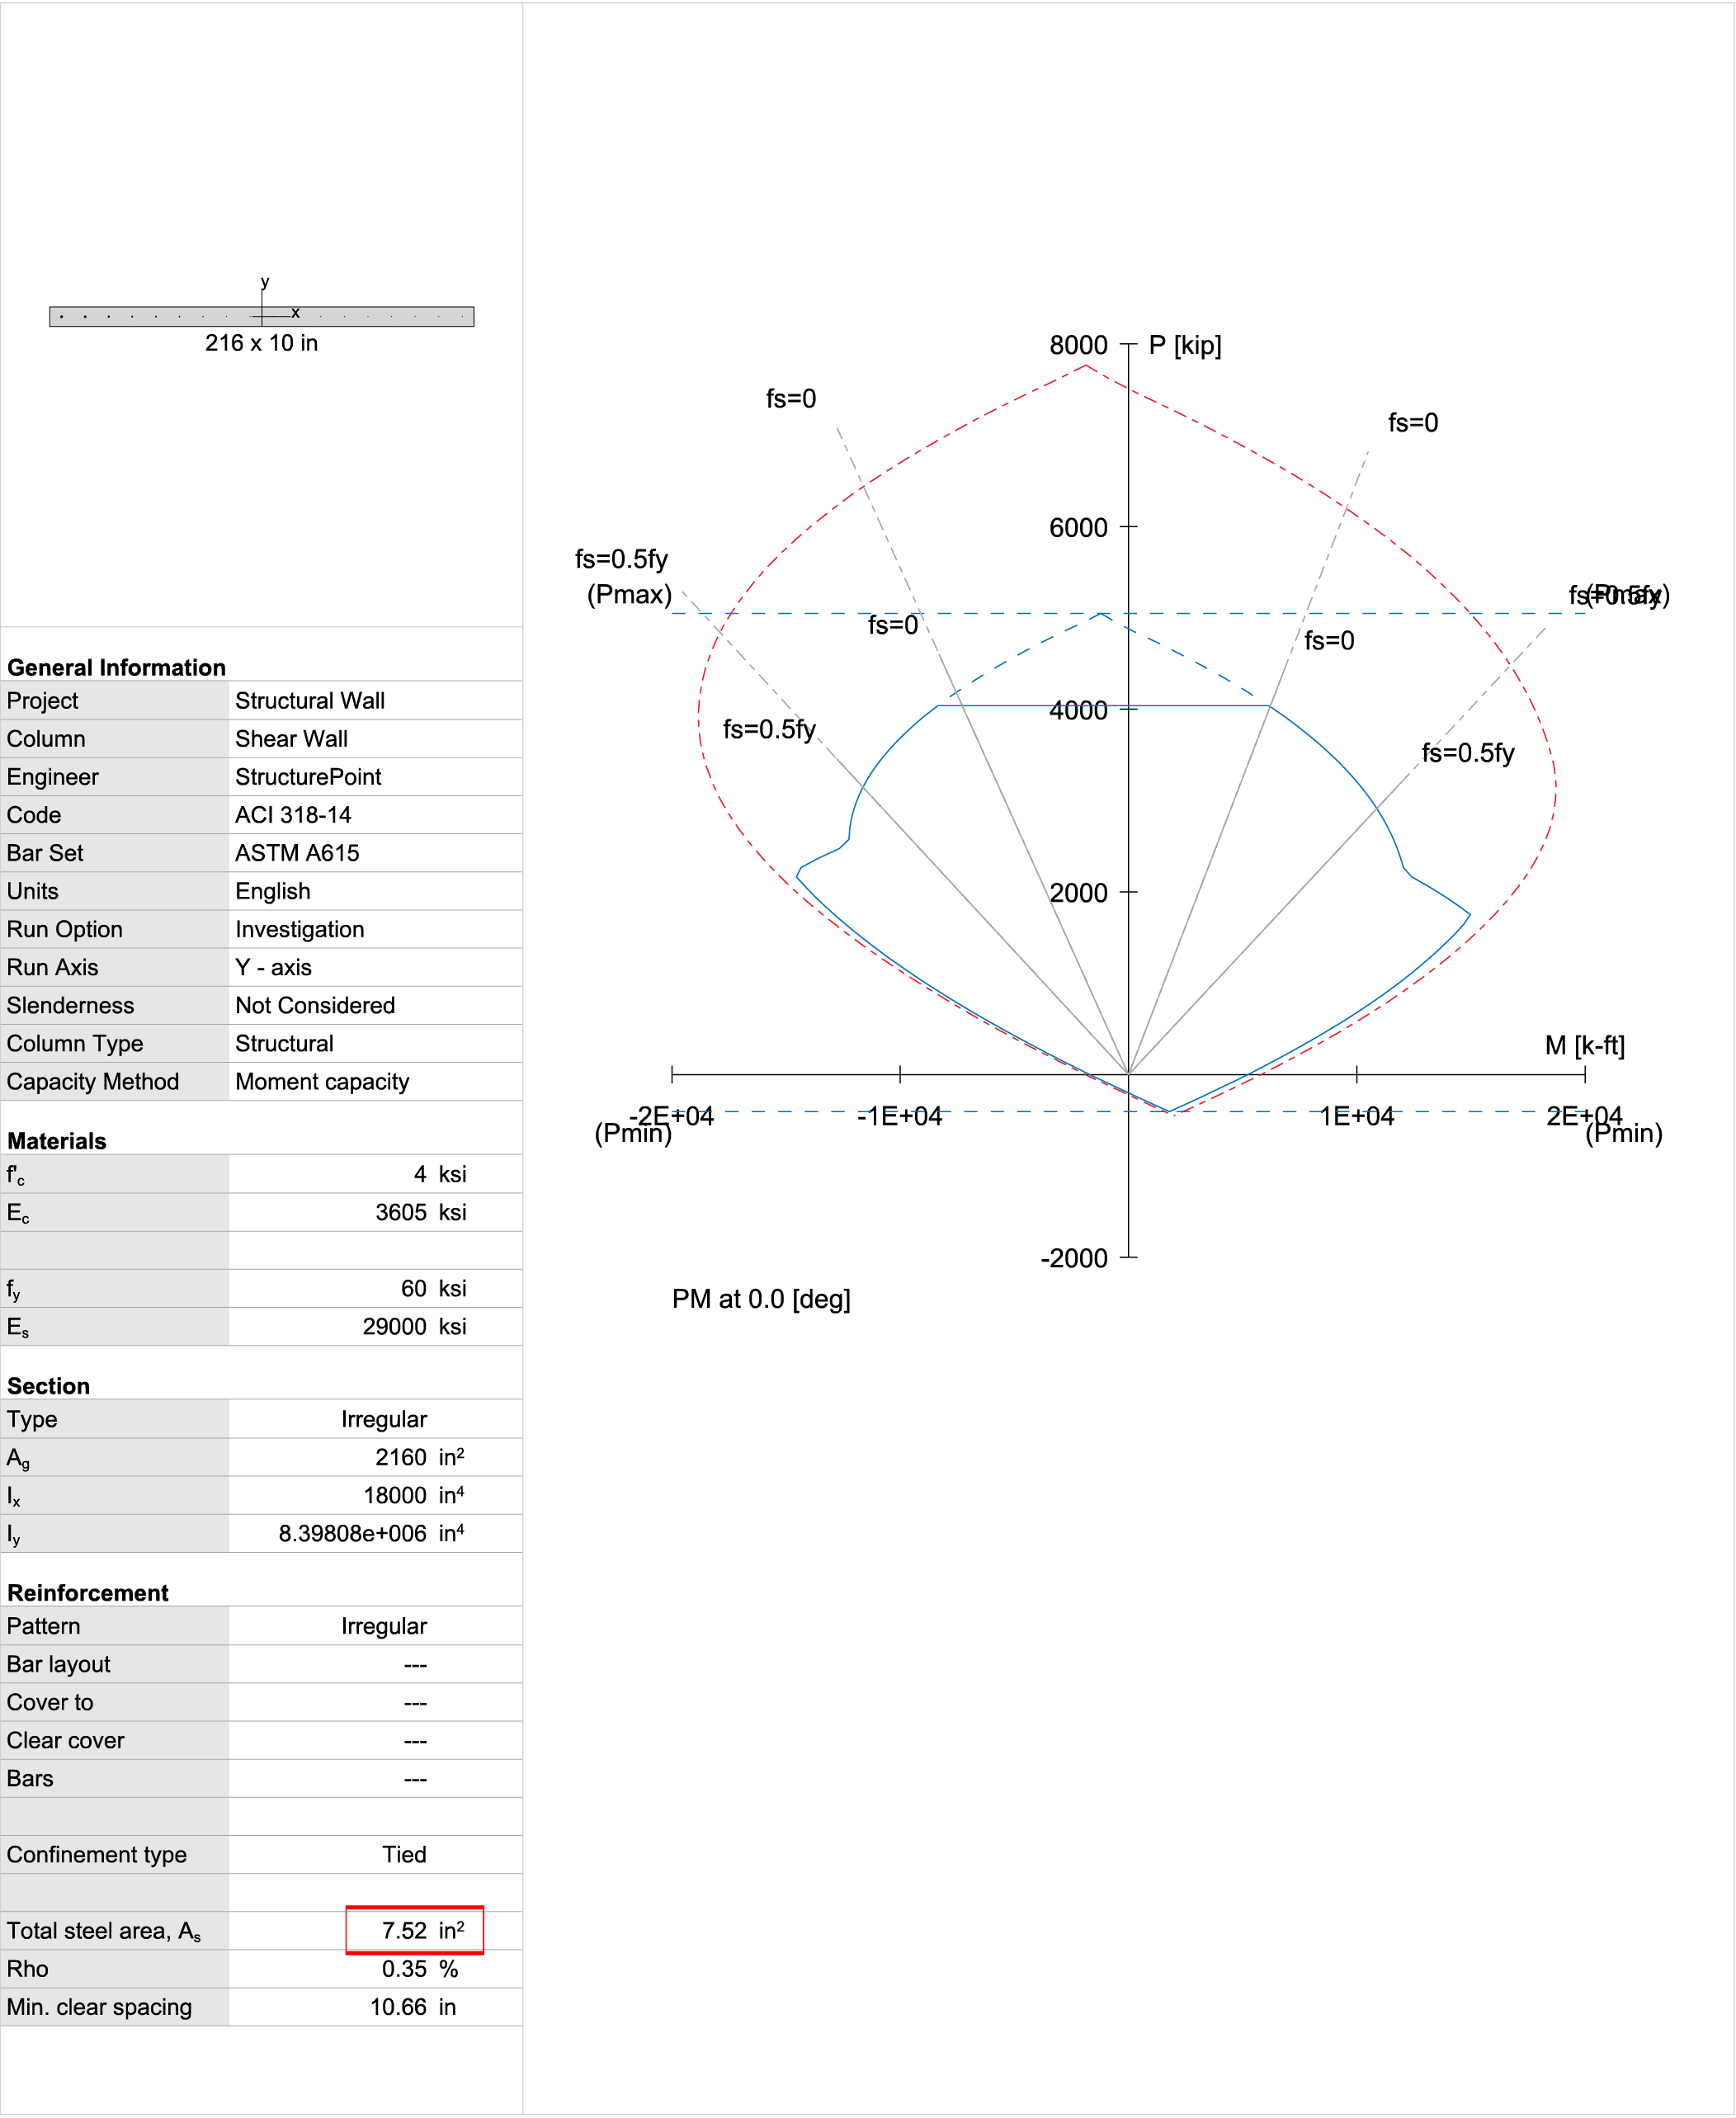
For illustration and comparison purposes, following figures provide a sample of the input and output of the results obtained from an spColumn model created for the shear wall in this example. spColumn calculates the values of strain at each layer of steel (in tension and compression zones) with location of the total tension and compression forces leading to the value for nominal and design strengths (axial and flexural strengths).

Figure 12 - Shear Wall Interaction Diagram (X-Axis, In-Plane) (spColumn)


Figure 13 - Load & Moment Capacities Output from spColumn
Using spColumn, calculate the expected wall capacity based on various reinforcement distributions obtained from the FEA results from spWall. Three reinforcement distributions are evaluated below.
Wall Capacity - Non-Uniform Reinforcement from FEA
Using the method of solution in spColumn where one section is used the finite element analysis model can be investigated as one section and not as individual finite elements as calculated by spWall.
Wall Capacity - Uniform Reinforcement from FEA
Taking the total area of non-uniform reinforcement obtained from FEA and redistributing it in a uniform bar pattern to represent a reinforcement arrangement very comparable to the reference example distribution, the wall capacity can be calculated and is expected to be very similar to the results obtained from the reinforcement configuration used by the reference.
Wall Capacity - Suggested Reinforcement
Taking the total area of non-uniform reinforcement obtained from FEA and redistributing it in a banded approach where the suggested reinforcement is averaged over the first 3 elements and the following 4 elements resulting in the suggested bar pattern below to represent a practical reinforcement arrangement, a new wall capacity can be calculated.
7.2. Conclusions & Observations
As can be seen from the three options above the engineers can evaluate several options when arriving at the reinforcing bar arrangement from an FEA model. The following conclusions and observations can be used to better understand designing and investigating shear walls using spWall:
1. In finite element analysis, selecting mesh size has a crucial impact on the results accuracy (as an example the amount and distribution of reinforcement). The mesh size should be optimized in a way that changing the element size has slight effect on the results obtained. However, the optimum element size is dependent on multiple parameters in the model which makes it difficult to find a generalized procedure to select the optimum size.
“Multiple studies” conducted by StructurePoint showed that the element length should not be greater than 10% of the total wall length and a coarser mesh should be used with caution and engineering judgement.
2. spWall calculates the required area of steel for each element along the section. This area of steel is selected in a way that it should be enough to satisfy the strength requirements under a specific sets of extreme design forces. This approach will lead to placing most of the reinforcement at wall section ends as was shown in this example leading to the highest possible flexural capacity that can be achieved for the section with the same amount of steel. In practice, having a uniform distribution of reinforcement along the wall section is more common and the flexural capacity of the concrete wall is usually calculated based on it.
3. Concrete Shear walls can be analyzed and designed using simplified structural analysis approaches as the one used in this example. However, as the level of complexity of the wall increases, analyzing and designing shear walls using hand solution become more challenging and less effective. Computer software utilizing FEA (e.g. spWall is an efficient solution to analyze and design concrete shear walls regardless of the level of complexity.
spWall selects the minimum required area of steel with the optimum reinforcement distribution for the wall section in which the highest bending capacity of the wall section is achieved. spColumn software can be also utilized to obtain the wall interaction diagram to help better understand the behavior of the section selected.