12. Design Results Comparison and Conclusions
The model shown above was created in spWall taking into account the ACI 318-14 provisions (Alternative Method for Out-of-Plane Slender Wall Analysis) and ACI 551 recommendations regarding the analysis and design of tilt-up wall panels with openings. In this model the left and right design strips are modeled such that the entire lateral and axial load, including self-weight above the critical section, are distributed to the two strips at each side of the opening. The tributary width for loads was taken as the width of the strip plus one-half the width of the opening. The following table shows the comparison between hand calculation results and spWall model results.
Table 1 - Comparison of Tilt-Up Wall Panel with Opening Analysis and Design Results | |||||||||
Solution | Mu (kip-ft) | Nu (kips) | Dz,service (in.) | Dz,ultimate (in.) | |||||
Design Strip | Left | Right | Left | Right | Left | Right | Left | Right | |
Hand (at midheight) | 31.68 | 37.38 | 31.87 | 37.97 | 0.203 | 0.164 | 6.311 | 6.091 | |
(at midheight)* | 32.23 | 37.64 | 32.00 | 37.88 | 0.204 | 0.164 | 6.395 | 6.091 | |
(at critical section)** | 32.26 | 37.67 | 32.00 | 37.88 | 0.204 | 0.164 | 6.396 | 6.092 | |
* ** | |||||||||
The results of all the hand calculations and the reference used illustrated above are in agreement with the automated exact results obtained from the spWall program.
12.1. Comparison of Wall Modeling Methods
ACI 318 provides the Alternative Method for Out-of-Plane Slender Wall Analysis as a simple and accurate option for analysis and design of simple walls meeting the method conditions. Other methods such as finite element analysis can be used to address panels not meeting the numerous limitations of the Alternative Method for Out-of-Plane Slender Wall Analysis (cantilevered walls, variable thickness and width, walls with openings, non-standard boundary conditions, walls with high compressive loads, in-plane lateral loads, non-standard concentrated load position from attachments of piping, racking etc., concentrated out of plane loads).
The exact wall geometry and applied loads were modeled using spWall engineering software to investigate the differences between the simplified approximate method and the finite element method. For illustration and comparison purposes, the following figures provide a sample of the results obtained from an spWall model created for the reinforced concrete wall in this example using exact wall geometry and applied loads.
It is very important to consider the wind load applied to the door opening and how it must be considered and applied in the model based on the door boundary condition. In this example, the door support reactions are assumed along the left and right side of the door opening. Load is modeled as an equivalent uniform line load applied along the right edge of the left leg and the left side of the right leg. The magnitude of this load is calculated as follows:

Figure 15 - Factored Axial Forces Contour - Exact Geometry and Loads (spWall)

Figure 16 - Tilt-Up Wall Panel Service Lateral Displacement Contour (Out-of-Plane) - Exact Geometry and Loads (spWall)

Figure 17 - Out-of-plane Shear Diagram - Exact Geometry and Loads (spWall)

Figure 18 - Tilt-Up Wall Panel with Opening Moment Diagram - Exact Geometry and Loads (spWall)

Figure 19 - Displacement at Critical Sections - Exact Geometry and Loads (Service Combinations) (spWall)

Figure 20 - Displacement at Critical Sections - Exact Geometry and Loads (Ultimate Combinations) (spWall)

Figure 21 - Tilt-Up Wall Panel with Opening Cross-Sectional Forces - Exact Geometry and Loads (spWall)
Table 2 - Comparison of Analysis Methods (at midheight) | ||||||||||
Solution | Mu (kip-ft) | Nu (kips) | Dz,service (in.) | Dz,ultimate (in.) | ||||||
Design Strip | Left | Right | Total | Left | Right | Total | Left | Right | Left | Right |
Simplified Model Approximate Design Strip (at y = 14.75 ft) | 32.23 | 37.64 | 69.87 | 32.00 | 37.88 | 69.88 | 0.204 | 0.164 | 6.395 | 6.091 |
Complete Model Exact Geometry and Loads (at y = 14.75 ft) | --- | --- | 58.82 | --- | --- | 69.85 | 0.151 | 0.143 | 4.949 | 4.627 |
Table 3 - Comparison of Analysis Methods (at critical section) | ||||||||||
Solution | Mu (kip-ft) | Nu (kips) | Dz,service (in.) | Dz,ultimate (in.) | ||||||
Design Strip | Left | Right | Total | Left | Right | Total | Left | Right | Left | Right |
Simplified Model Approximate Design Strip (at y = 15.00 ft) | 32.26 | 37.67 | 69.93 | 32.00 | 37.88 | 69.88 | 0.204 | 0.164 | 6.396 | 6.092 |
Complete Model Exact Geometry and Loads (at y = 14.00 ft) | --- | --- | 59.17 | --- | --- | 70.83 | 0.152 | 0.144 | 5.001 | 4.659 |
Using the complete model with the exact wall geometry and applied loads compared with the simplified model of two equivalent design strip results in:
1. Reduction in the required moment capacity by approximately 16%.
2. Reduction in the out-of-plane displacements, at service and ultimate levels by approximately 19% to 23% respectively.
The complete model, as shown in the following figure, displays a complete view of the torsional moment distribution indicating areas of torsional stress concentration at opening edges. This corresponds to the additional reinforcement requirements outlined in ACI 318-14 (11.7.5.1) for header and jambs of openings for improved serviceability.

Figure 22 - Tilt-Up Wall Panel with Opening Torsional Moment Contour (spWall)
12.2. Tilt-Up Wall Stiffness Reduction
In column and wall analysis, section properties shall be determined by taking into account the influence of axial loads, the presence of cracked regions along the length of the member, and the effect of load duration (creep effects). ACI 318 permits the use of reduced moment of inertia values of 0.70 Ig for uncracked walls and 0.35 Ig for cracked walls.
ACI 318-14 (6.6.3.1.1)
In spWall program, these effects are accounted for where the user can input reduced moment of inertia using “cracking coefficient” values for plate and stiffener elements to effectively reduce stiffness. Cracking coefficients for out-of-plane (bending and torsion) and in-plane (axial and shear) stiffness can be entered for plate elements. Because the values of the cracking coefficients can have a large effect on the analysis and design results, the user must take care in selecting values that best represent the state of cracking at the particular loading stage. Cracking coefficients are greater than 0 and less than 1.
At ultimate loads, a wall is normally in a highly cracked state. The user could enter a value of out-of-plane cracking coefficient for plates of Icracked/Igross based on estimated values of As. after the analysis and design, if the computed value of As greatly differs from the estimated value of As, the analysis should be performed again with new values for the cracking coefficients. A factor 0.75 can be also used to reduce the calculated bending stiffness of the concrete section in accordance with ACI 318-14 Chapter 11. It is intended to account for variations in material properties and workmanship. This reduction factor in bending stiffness should be incorporated by all other alternate design methods to comply with the requirements of ACI 318 as ACI 551 committee stated.
At service loads, a wall may or may not be in a highly cracked state. For service load deflection analysis, a problem should be modeled with an out-of-plane cracking coefficient for plates of (Ieffective/Igross).
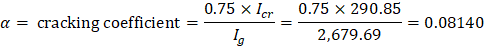
Based on the previous discussion, the ratio between Icr and Ig including the reduction factor (0.75) can be used as the cracking coefficient for the out-of-plane case for the ultimate load combinations. In this example, Icr and Ig were found to be equal to 290.85 in.4 and 2,679.69 in.4 for the left leg (design strip). Thus, the out-of-plane cracking coefficient for ultimate load combinations for the left leg can be found as follows:
For the service load combinations, it was found that Ma for the left leg equals to 12.55 ft-kip which is less than Mcr = 24.21 ft-kip. That means the left leg section is uncracked and the cracking coefficient can be taken equal to 1.

Figure 23 - Defining Cracking Coefficient (spWall)
12.3. Comparison of Load Type Effects
During the process of analyzing the tilt-up wall panels, the effect of load type on the wall behavior at the critical section (mid-height of the unbrace wall length) was investigated in terms of out-of-plane deflection at service and ultimate level, required axial capacity, and required out-of-plane moment capacity.
Table 4 - Effect of Load Type on the Wall Behavior (at midheight) | ||||||||||
Solution | Mu (kip-ft) | Nu (kips) | Dz,service (in.) | Dz,ultimate (in.) | ||||||
Left | Right | Total | Left | Right | Total | Left | Right | Left | Right | |
Actual Joists Point Loads | --- | --- | 58.82 | --- | --- | 69.85 | 0.151 | 0.143 | 4.949 | 4.627 |
Equivalent Uniform Line Load | --- | --- | 58.82 | --- | --- | 69.85 | 0.151 | 0.143 | 4.953 | 4.620 |
Using equivalent uniform line load along the section width to represent the actual joists point loads has only a slight effect on the results obtained at the critical section (mid-height of the unbrace wall length). However, modeling point loads to reflect actual behavior and stress distribution is beneficial in cases where there are openings, variable thicknesses, changes in geometry, intermediate supports, and other variations from a simply supported wall with constant width and thickness.
12.4. Cracking Coefficient and Effective Flexural Stiffness of Concrete Walls
The cracking coefficient for tilt-up wall panels can be calculated using different ACI 318 provisions. The following shows the commonly used provisions to calculate the cracked (or effective) moment of inertia used in the cracking coefficient calculations used in spWall models:
1. 0.35 Ig for cracked walls and 0.70 Ig for uncracked walls ACI 318-14 (Table 6.6.3.1.1(a)) 2. When treating the wall as compression member: ACI 318-14 (Table 6.6.3.1.1(b1)) 3. When treating the wall as flexural member: ACI 318-14 (Table 6.6.3.1.1(b2)) 4. Using the moment magnification procedure for nonsway frames: ACI 318-14 (6.6.4.4.4(b)) 5. Using the moment magnification procedure for nonsway frames: ACI 318-14 (6.6.4.4.4(a)) 6. Using the Alternative Method for Out-of-Plane Slender Wall Analysis: ACI 318-14 (11.8.3.1(c))
11.8.3.1(c) is used in this example to calculate the cracking coefficient for the wall section modeled in spWall. This is intended to best match the reference approach using the Alternative Method for Out-of-Plane Slender Wall Analysis to analyze and design the tilt-up wall panels.
The variation in the magnitude of the cracking coefficient has a significant effect on the analysis results and specifically the wall moments and displacements. The following table illustrates the effect of using the above equations on the program results.
Table 5 - Comparison of (Icr or Ieff) Effect on Results | |||||||||||
Method | Icr or Ieff, in.4 | Cracking coefficient (α) for spWall | Mu, kip-ft | Dz,service, in. | Dz,ultimate, in. | ||||||
Left | Right | Left | Right | Left | Right | Total | Left | Right | Left | Right | |
Table 6.6.3.1.1(a) | 938 | 1407 | 0.350 | 0.350 | 17.03 | 20.03 | 37.06 | 0.204 | 0.164 | 0.80 | 0.63 |
Table 6.6.3.1.1(b1) | 2345 | 3517 | 0.875 | 0.875 | 15.66 | 18.77 | 34.43 | 0.204 | 0.164 | 0.30 | 0.24 |
Table 6.6.3.1.1(b2) | 670 | 1005 | 0.250 | 0.250 | 18.08 | 20.96 | 39.04 | 0.204 | 0.164 | 1.19 | 0.91 |
6.6.4.4.4b | 268 | 402 | 0.100 | 0.100 | 26.56 | 27.65 | 54.21 | 0.204 | 0.164 | 4.31 | 2.99 |
6.6.4.4.4a | 536 | 804 | 0.200 | 0.200 | 19.11 | 21.85 | 40.96 | 0.204 | 0.164 | 1.56 | 1.19 |
11.8.3.1c | 291 | 356 | 0.109 | 0.088 | 25.04 | 29.69 | 59.73 | 0.204 | 0.164 | 3.75 | 3.62 |
11.8.3.1c with reduction factor (from 11.8.3.1d) | 218 | 267 | 0.081 | 0.066 | 32.23 | 37.64 | 69.87 | 0.204 | 0.164 | 6.40 | 6.09 |
From the table above the following can be observed:
1. The values above reveal the necessity to carefully select Icr or Ieff values (and the corresponding α value) to ensure the wall moment capacity and estimated deflections are calculated with sufficient conservatism ensuring adequate strength and stability.
2. The Dz,service values are unaffected by the method used to calculate Icr or Ieff since the section is uncracked and the cracking coefficient α is taken as 1.
3. The Dz,ultimate, values are calculated however are not used in any calculations and the deflection limits are given for Dz,service only.
4. The range of the cracking coefficient and the cracked (or effective) moment of inertia values vary widely based on the equation used.
5. In this example the spWall model utilized the value of the cracked moment of inertia using the alternative analysis method equation 11.8.3.1(c) with reduction factor from 11.8.3.1(d).