13. Tilt-Up Wall Reinforcement and Cracking Coefficient Optimization
In the previous models, the cracking coefficients were selected based on the area of steel used by the reference and equation 11.8.3.1c with the reduction factor to best match the reference. The reinforcement selected in the reference is conservative and results in a higher cracking moment of inertia leading to lower values of reinforcement to be obtained by spWall.
To explore this topic in further details, the left leg (design strip) model results will be used. Icr for this model based on 7 #6 bars (As = 3.08 in.2) vertical reinforcement was found to be equal to 290.85 in.4 which leads to a 0.08140 cracking coefficient (the model outputs are highly dependent on and sensitive to the cracking coefficient and up to 5 significant figures is recommended). Using this value, the required area of steel of 1.180 in.2 is less than the provided area of steel used to calculate the cracking coefficient by 61.7%. This is expected since the provided area of steel in reference example is much higher than the required (ϕMn = 60.13 ft-kip >> Mu = 31.68 ft-kip).
The use of the required area of steel from this model in this case is insufficient because it is based on a high assumed value of the cracking coefficient. To confirm this, a model was reanalyzed using the new required area of steel (1.180 in.2) to calculate the cracking coefficient (0.05272). spWall in this case shows that the model is failing and the following error will be provided:

Figure 24 - Failing Reinforcement Error (spWall)
In order to find the optimum required area of steel and the associated cracking coefficient for ultimate combinations using spWall, the following procedure should be followed:
spWall Manual v10.00 Chapter 2
1. Estimate the value of As. | |
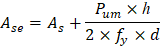
2. Calculate Ase using the following equation: | |
| ACI 318-14 (R11.8.3.1) |
Where Ase is the effective area of longitudinal reinforcement in a slender wall. | |
3. Calculate Icr using the following equation: | |
ACI 318-14 (11.8.3.1(c)) | |
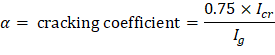
4. Calculate the cracking coefficient using the following equation: | |
| |
Where the 0.75 is bending stiffness reduction factor of the concrete section in accordance with ACI 318-14, Chapters 11. It is intended to account for variations in material properties and workmanship. | |
5. Run the first model in spWall using the initial cracking coefficient. After analysis and design, if the computed value of As (As,n+1) is greatly differs from the estimated value of As (As,n), the analysis should be performed again with the new values of As and cracking coefficient until As,n ≈ (As,n+1).
The following table shows the iteration stages to obtain the optimum area of steel for the left leg (design strip) wall of this example using the procedure described above:
Table 6 - Area of Steel Optimization (Using the Proposed Procedure) | ||||
Iteration # | As,n, in.2 | Cracking Coefficient | As,n+1, in.2 | Difference, % |
1 | 3.080 | 0.08140 | 1.180* | 61.7 |
2 | 1.220** | 0.05355 | 27.885 | -2185.7 |
3 | 2.150 | 0.06939 | 1.664 | 22.6 |
4 | 1.664 | 0.06183 | 2.320 | -39.4 |
5 | 1.907 | 0.06578 | 1.916 | -0.5 |
6 | 1.912 | 0.06585 | 1.912 | 0.0 |
* Model wall reinforcement design failed ** The lowest wall reinforcement value that will produce a viable model | ||||
Using this procedure above for the left leg, we started with 3.080 in.2, the value used by the reference. After a few iterations with averaging of two consecutive reinforcement areas, it was found that the solution converged at 1.912 in.2 as the optimum reinforcement area. For illustration and comparison purposes, the following figures provide a sample of the results obtained from the spWall model created for the reinforced concrete wall with the optimum area of steel (1.912 in.2).

Figure 25 - Factored Axial Forces Contour Normal to the Left Design Strip Cross-Section (spWall)

Figure 26 - Service Lateral Displacement Contour (Out-of-Plane) (spWall)

Figure 27 - Vertical Reinforcement Contour (in.2/ft) (spWall)

Figure 28 - Out-of-plane Shear Diagram (spWall)

Figure 29 - Tilt-Up Wall Panel with Opening Moment Diagram (spWall)

Figure 30 - Cross-Sectional Vertical Reinforcement (spWall)

Figure 31 - Lateral Displacement at Critical Sections (Service Combinations) (spWall)

Figure 32 - Lateral Displacement at Critical Sections (Ultimate Combinations) (spWall)

Figure 33 - Cross-Sectional Forces (spWall)
The hand calculation procedure shown earlier is repeated for the left leg based on the optimum area of steel (As = 1.912 in.2) as follows:
| |
|
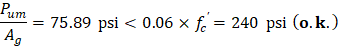
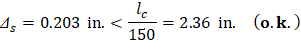
The above calculations reveal a reduction in the cracked moment of inertia resulting in an increase in the Mu applied. Note that the moment capacity is now very close to the required moment.
The following table shows the comparison between hand results with spWall model results for the optimum area of steel.
Table 7 - Comparison of Tilt-Up Wall Panel with Opening Analysis and Design Results | ||||||
Solution | Mu (kip-ft) | Nu (kips) | Dz,service (in.) | Dz,ultimate (in.) | As,required (in.2) | |
Hand (at midheight) | 43.13 | 31.87 | 0.203 | 10.619 | 1.912 | |
(at midheight)* | 44.00 | 32.00 | 0.204 | 10.734 | 1.912 | |
(at critical section)** | 44.04 | 32.00 | 0.204 | 10.734 | 1.916 | |
* ** | ||||||
After following the reinforcement optimization procedure, the results of all the hand calculations used above are in agreement with the automated exact results obtained from the spWall program including the required area of steel.