3.52View Group Results
Analyze/Group Results command allows you to view and/or print the results for the member groups (defined using the Process/Member Group command) in graphical and text format. Group results represent the minimum and maximum values of all grouped members under all defined load combinations (i.e. envelope of envelopes).
•From the Analyze menu, select Group Results. The dialog box of Figure 3-47 appears.
•From the GROUP LIST list box, select a group.
•From the OPTIONS drop-down list, select one of the applicable results to display. Choices are in-plane shear (Fy), in-plane moment (Mz), axial force (Fx), out-of plane shear (Fz), out-of-plane moment (My), and torsional moment (Mx). These results are referenced in the member local coordinate system.
•The graphical plot of the result option is shown in two different colors representing the minimum and maximum values. The horizontal axis of the graph represents the member length with the member start joint (J1) being on the left and the member end joint (J2) on the right. The vertical axis represents the result option selected. Also shown on the graph, the minimum and maximum values of the result option.
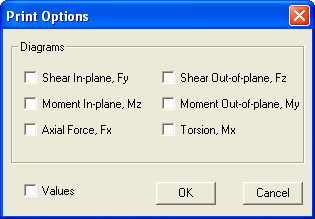
Figure 3-47 Print Options dialog box