2. Bresler Load Contour Method
In this method, the surface S3 (Pn, Mnx, Mny) is approximated by a family of curves corresponding to constant values of Pn. These curves, as illustrated in "Figure 10 - Bresler Load Contours for Constant Pn on Failure Surface S3", may be regarded as “load contours”.
Figure 10 - Bresler Load Contours for Constant Pn on Failure Surface S3
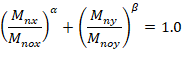
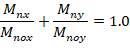
The general expression for these curves can be approximated by a nondimensional interaction equation of the form:
Mnx = The nominal biaxial moment strength in the direction of x axis
Mny = The nominal biaxial moment strength in the direction of y axis
Mnox = The nominal uniaxial moment strength about the x-axis
Mnoy = The nominal uniaxial moment strength about the y-axis
Note that (Mnx and Mny) are the vectorial equivalent of the nominal uniaxial moment Mn. The values of the exponents α and β are a function of the amount, distribution and location of reinforcement, the dimensions of the column, and the strength and elastic properties of the steel and concrete. Bresler indicates that it is reasonably accurate to assume that α = β; therefore, the previous equation becomes (shown graphically in "Figure 11 - Interaction Curves for Bresler Load Contour Method"):
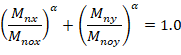
Figure 11 - Interaction Curves for Bresler Load Contour Method
When using the previous equation or figure, it is still necessary to determine the α value for the cross-section being designed. Bresler indicated that, typically, α varied from 1.15 to 1.55, with a value of 1.5 being reasonably accurate for most square and rectangular sections having uniformly distributed reinforcement.
With α set at unity, the interaction equation becomes linear:
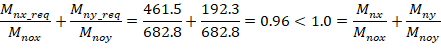
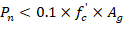
The previous equation would always yield conservative results since it underestimates the column capacity, especially for high axial loads or low percentages of reinforcement. It should only be used when:

The reference conservatively selected α = 1.0 due to a lack of available data. Check if flexure does not govern design:

Although 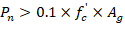 , the reference decided to carry out the necessary calculations for illustration purposes.
Since the section is symmetrical:
 ("Figure 6 - Column Section Capacity Interaction Diagram (spColumn)")