Design Data

Code

Building Code Requirements for Structural Concrete (ACI 318-19) and Commentary (ACI 318R-19)

References

spColumn Engineering Software Program Manual v10.00, STRUCTUREPOINT, 2021

Interaction Diagram - Tied Reinforced Concrete Column Design Strength (ACI 318-19)” Design Example, STRUCTUREPOINT, 2022

Interaction Diagram - Circular Spiral Reinforced Concrete Column (ACI 318-19)” Design Example, STRUCTUREPOINT, 2022

Interaction Diagram - Tied Reinforced Concrete Column with High-Strength Reinforcing Bars (ACI 318-19)” Design Example, STRUCTUREPOINT, 2022

Interaction Diagram - Barbell Concrete Shear Wall Unsymmetrical Boundary Elements (ACI 318-19)” Design Example, STRUCTUREPOINT, 2022


Design Data

fc = 6,000 psi

fy = 60,000 psi

Cover = 2 in. (to bar center)

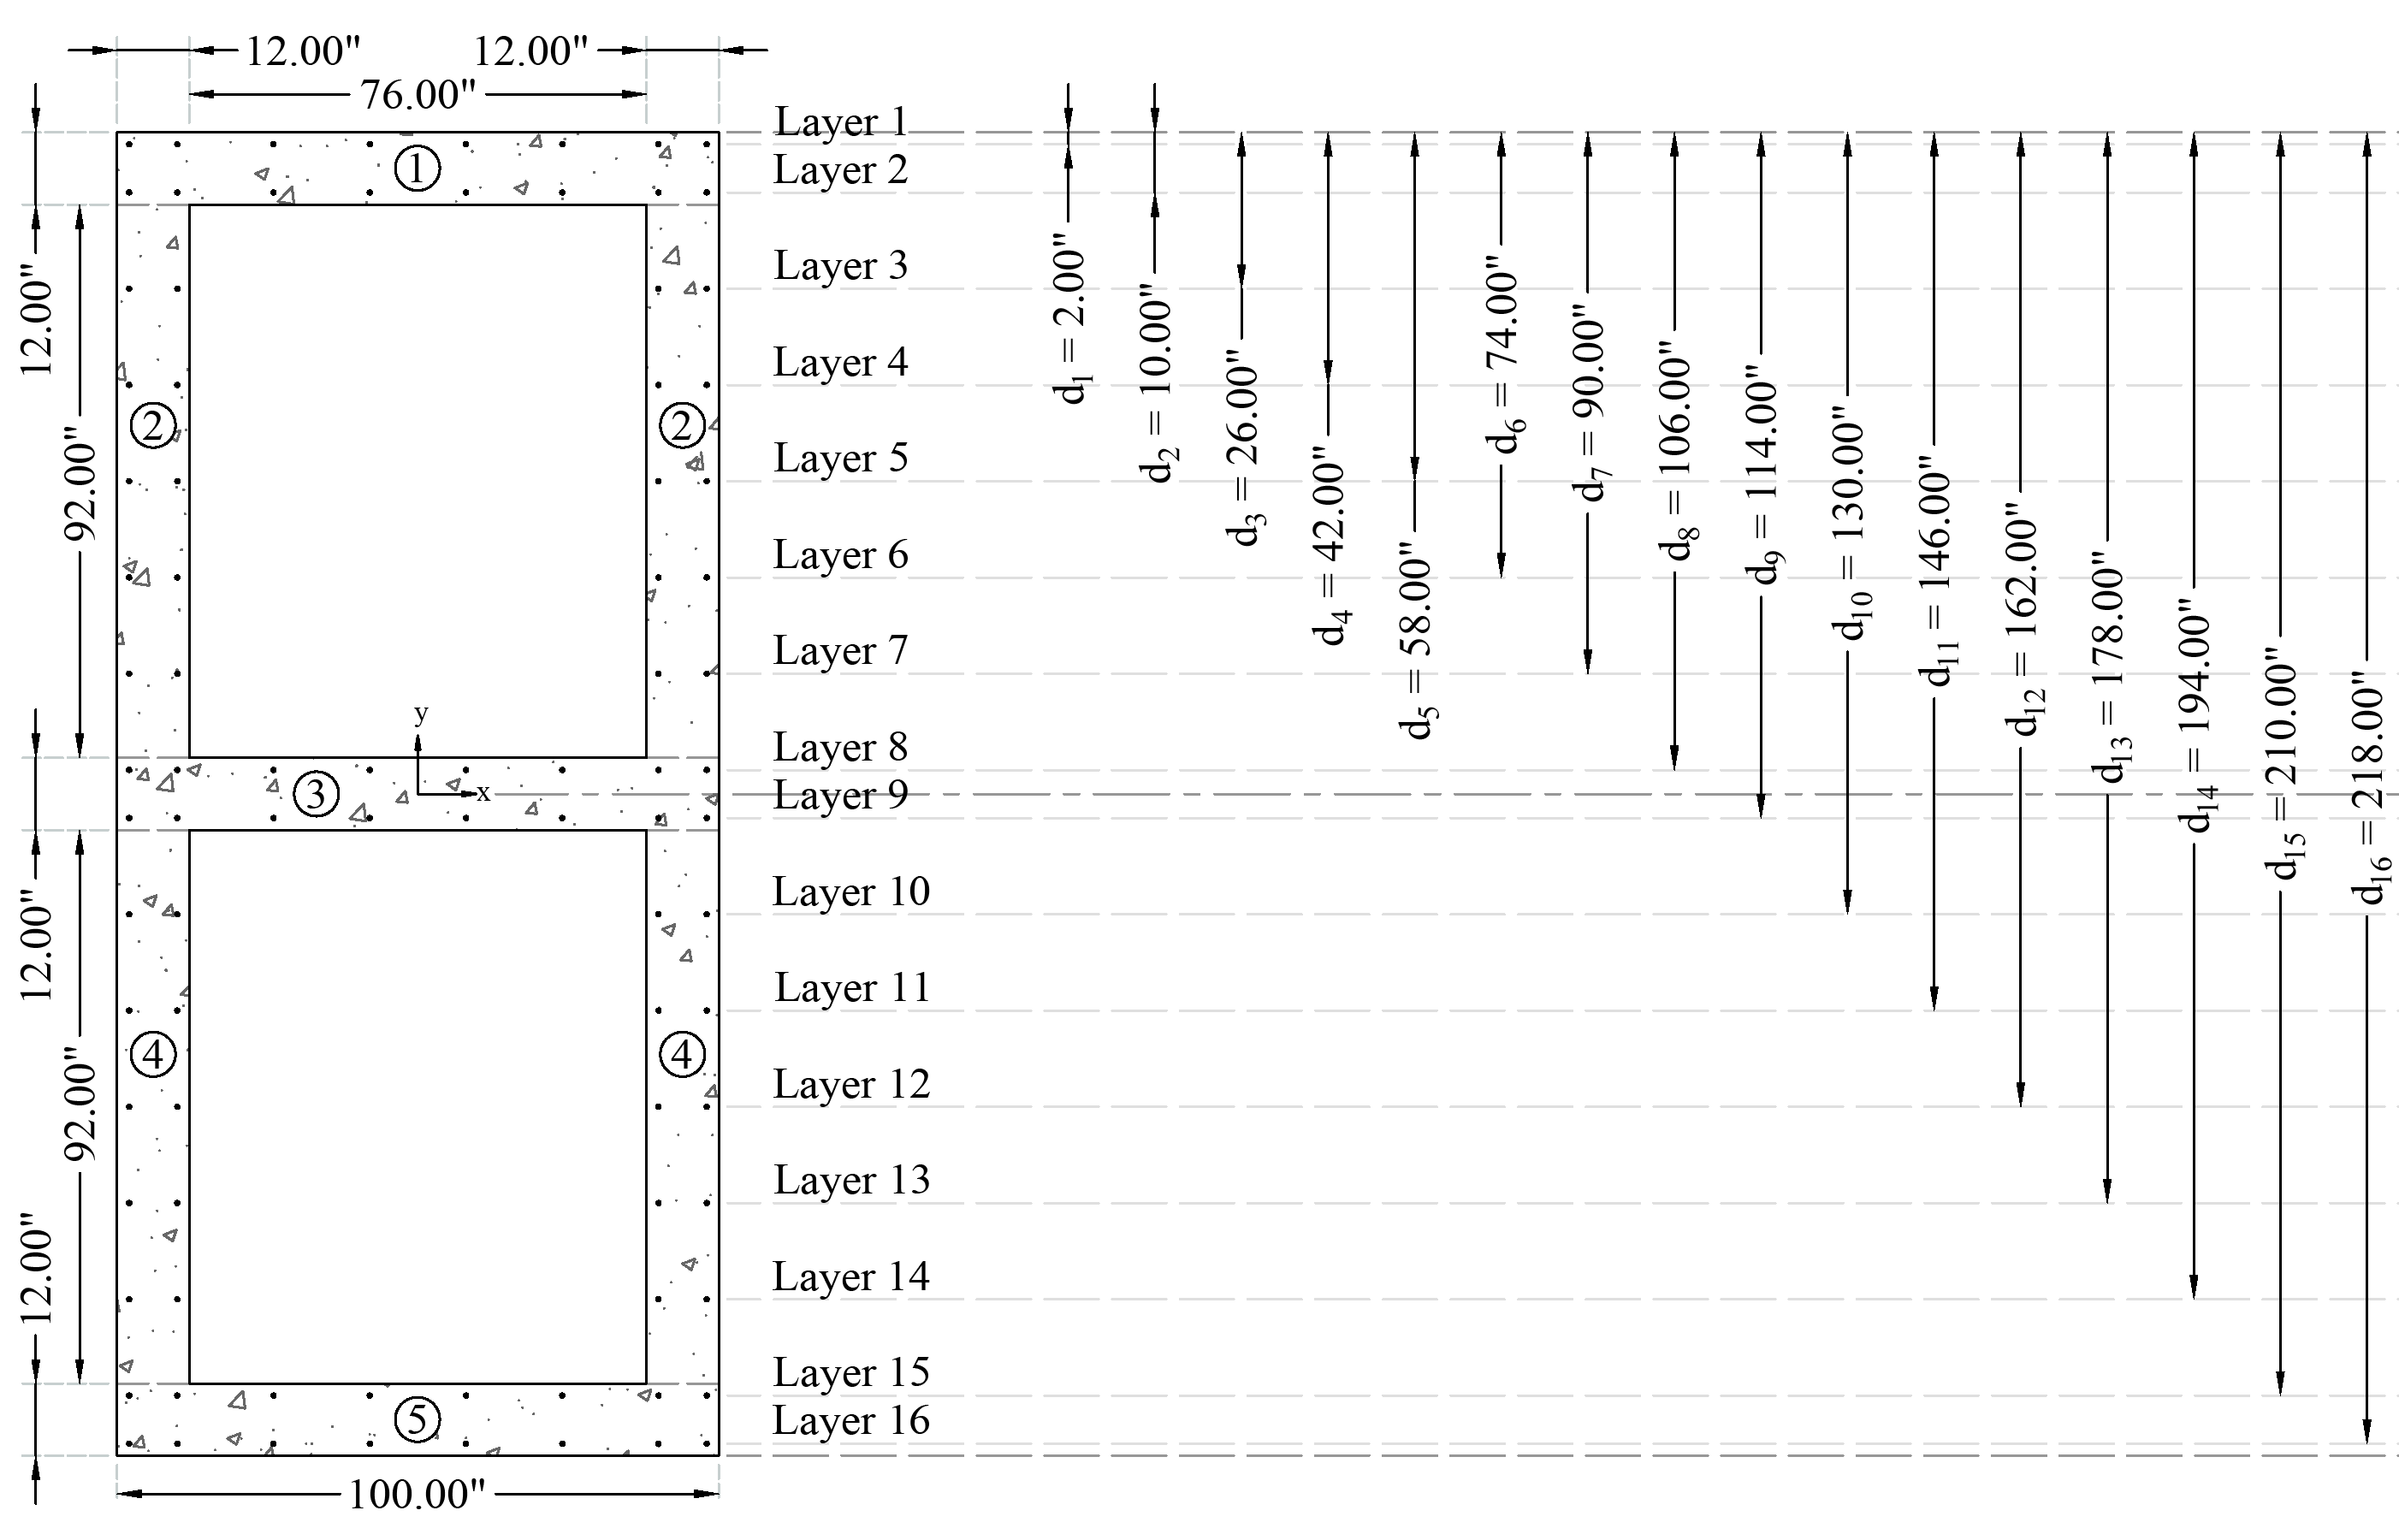
The reinforcement size and location selected for this core wall section are shown in following figure.

Detailed relevant steel bar and concrete shape data are tabulated below.

Table 1 - Reinforcement Data

Layer

Bar Size

As/bar, in2

# of bars

d, in

1

#5

0.79

8

2.0

2

#5

0.79

8

10.0

3

#5

0.31

4

26.0

4

#5

0.31

4

42.0

5

#5

0.31

4

58.0

6

#5

0.31

4

74.0

7

#5

0.31

4

90.0

8

#5

0.31

8

106.0

9

#5

0.31

8

114.0

10

#5

0.31

4

130.0

11

#5

0.31

4

146.0

12

#5

0.31

4

162.0

13

#5

0.31

4

178.0

14

#5

0.31

4

194.0

15

#5

0.31

8

210.0

16

#5

0.31

8

218.0


Table 2 - Concrete Shape Data

Part

h, in

b, in

Ac/part, in2

1

12.0

100.0

1200.0

2

92.0

24.0

2208.0

3

12.0

100.0

1200.0

4

92.0

24.0

2208.0

5

12.0

100.0

1200.0


Ac (total), in2

8016.0


05 Cross Section and Reinforcement Design Data

Figure 2 - Reinforced Concrete Core Wall - Cross-Section and Reinforcement Design Data


Solution

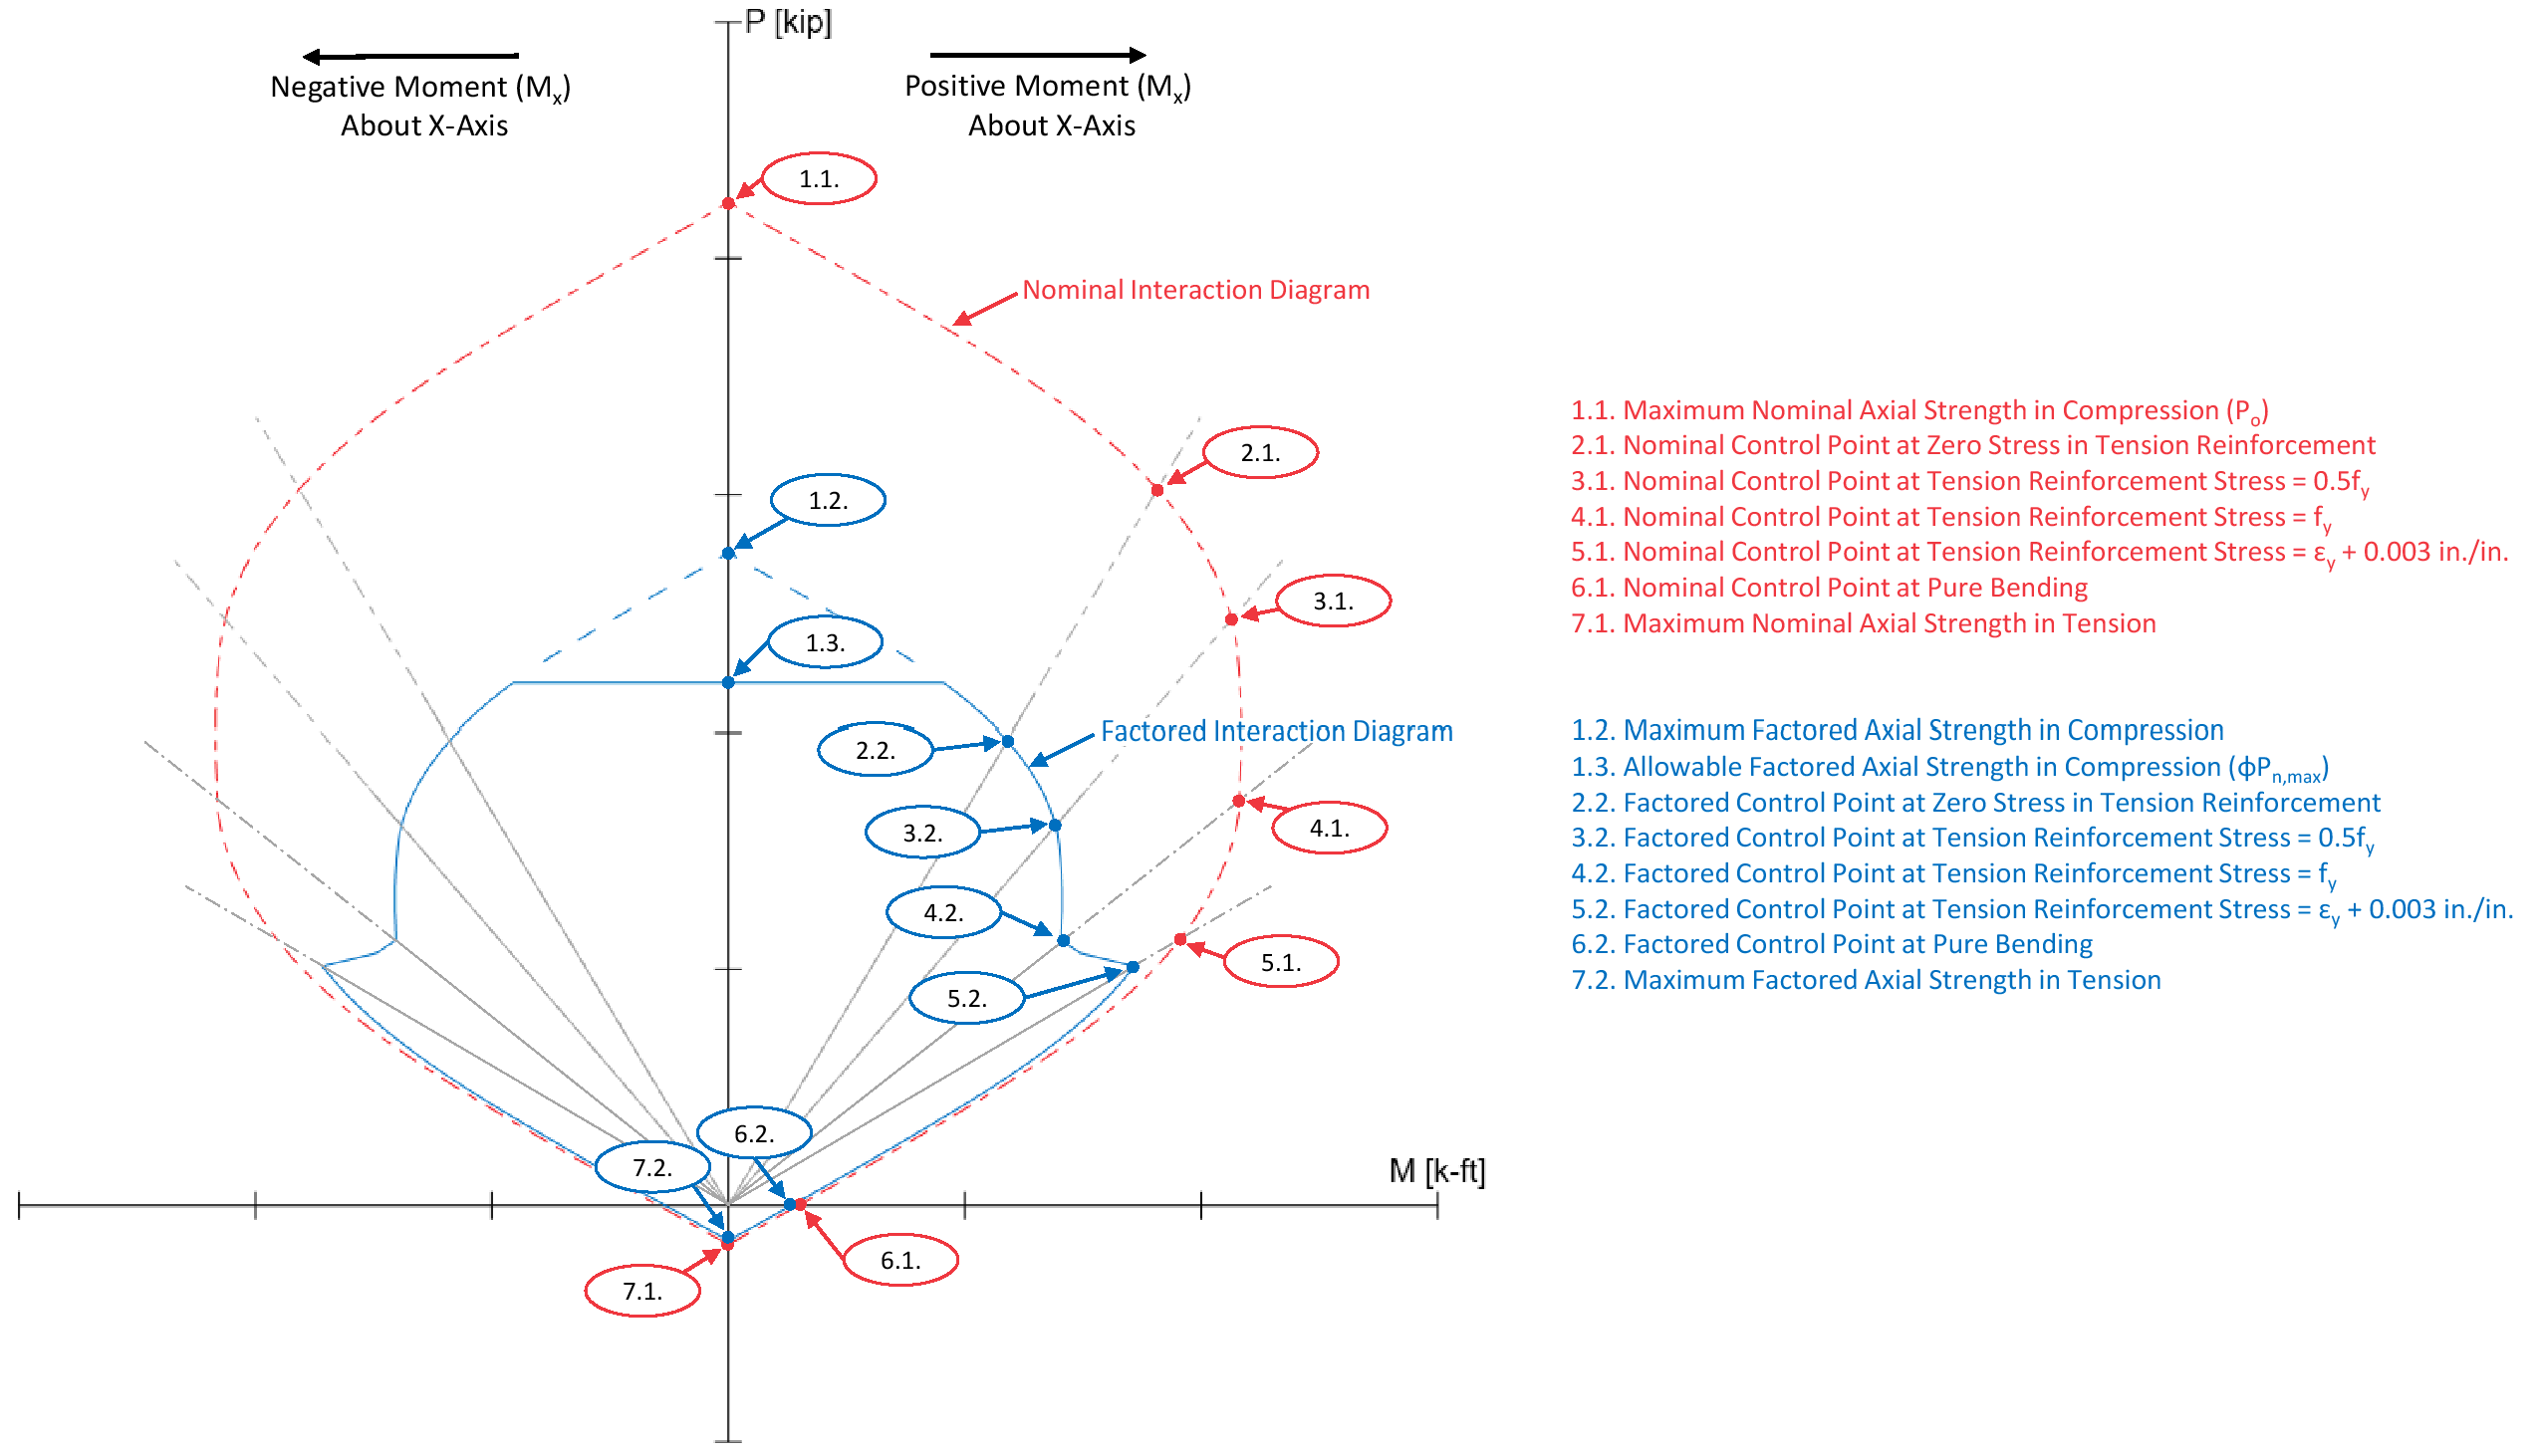
Use the traditional detailed approach to generate the interaction diagram for the concrete wall section shown above by determining the following seven control points for positive and negative moment about the x-axis:

Point 1: Maximum compression

Point 2: Bar stress near tension face equal to zero, (fs = 0)

Point 3: Bar stress near tension face equal to 0.5 fy (fs = 0.5 fy)

Point 4: Bar stress near tension face equal to fy (fs = fy)

Point 5: Bar strain near tension face equal to ɛy + 0.003

Point 6: Pure bending

Point 7: Maximum tension

Several terms are used to facilitate the following calculations:

Ag

= gross area of concrete section, in2.


= geometric centroid location along the y-axis, in.

Po

= nominal axial compressive strength, kip

ϕPo

= factored axial compressive strength, kip

ϕMo

= moment strength associated with the factored axial compressive strength, kip-ft

ϕPn,max

= maximum (allowable) factored axial compressive strength, kip

c

= distance from the fiber of maximum compressive strain to the neutral axis, in.

a

= depth of equivalent rectangular stress block, in.

Ap

= gross area of equivalent rectangular stress block, in2.


= plastic centroid location along the y-axis, in.

Cc

= compression force in equivalent rectangular stress block, kip

ɛs,i

= strain value in reinforcement layer i, in./in.

Cs,i

= compression force in reinforcement layer i, kip

Ts,i

= tension force in reinforcement layer i, kip


06 Core wall Control Points

Figure 3 - Core Wall Section Interaction Diagram Control Points