Now that the structural analysis is completed for all applicable live load patterns, and the enveloped moments are determined we can evaluate the impact of moment redistribution.
Moment redistribution is dependent on adequate ductility in plastic hinge regions. Plastic hinge regions develop at sections of maximum positive or negative moment and cause a shift in the elastic moment diagram. The usual result is a reduction in the values of maximum negative moments in the support regions and an increase in the values of positive moments between supports from those computed by elastic analysis. However, because negative moments are determined for one loading arrangement and positive moments for another, economies in reinforcement can sometimes be realized (depending on the load pattern) by reducing maximum elastic positive moments and increasing negative moments, thus narrowing the envelope of maximum negative and positive moments at any section in the span. The plastic hinges permit the utilization of the full capacity of more cross sections of a flexural member at ultimate loads.
ACI 318-14 (R6.6.5)
The ACI code allows the reduction of factored moments calculated by elastic theory at sections of maximum negative or maximum positive moment in any span of continuous flexural members for any assumed loading arrangement by a percentage equal to 1000 εt up to a maximum of 20 percent.
ACI 318-14 (6.6.5.3)
Redistribution of moments shall be made only when εt is equal to or greater than 0.0075 at the section at which moment is reduced.
ACI 318-14 (6.6.5.1)
Static equilibrium shall be maintained after redistribution of moments for each loading arrangement. The reduced moment shall be used for calculating redistributed moments at all other sections within the spans.
ACI 318-14 (6.6.5.4)
2.1. Reduction Percentage Calculations
Using d = 14.00 in. and cover = 1.50 in.
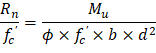
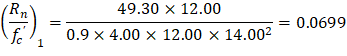
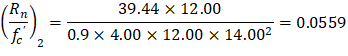
Calculate the coefficient of resistance using the following equation:
| PCA Notes on ACI 318-11 (8.4 Eq. 2) |
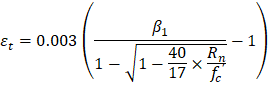
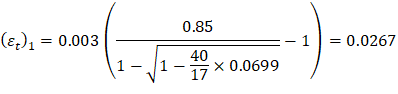
Calculate the net tensile strain (εt) using the following equation:
| PCA Notes on ACI 318-11 (8.4 Eq. 8) |
For Mu use envelope value at support face. Based on εt calculate the adjustment. Iterate until the adjusted moments converge (start repeating) as follows: (see the following table)
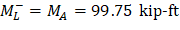
For negative moment at support D:
First Iteration
| |
| |
| |
|

Second Iteration

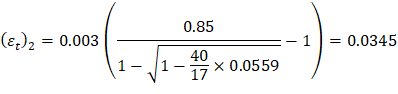

Since Adjustment1 = Adjustment2 à End of Iterations
A | B | C | D | ||||
Right | Left | Right | Left | Right | Left | ||
Iteration 1 | Mu (ft-kip) | 83.53 | 91.92 | 41.57 | 32.97 | 57.22 | 49.30 |
Rn/fc' | 0.118 | 0.130 | 0.059 | 0.047 | 0.081 | 0.070 | |
εt (in./in.) | 0.014 | 0.012 | 0.032 | 0.042 | 0.022 | 0.027 | |
Adjustment (%) | 13.93 | 12.25 | 20.00 | 20.00 | 20.00 | 20.00 | |
Iteration 2 | Mu (ft-kip) | 71.90 | 80.67 | 33.26 | 26.38 | 45.77 | 39.44 |
Rn/fc' | 0.102 | 0.114 | 0.047 | 0.037 | 0.065 | 0.056 | |
εt (in./in.) | 0.017 | 0.015 | 0.042 | 0.054 | 0.029 | 0.034 | |
Adjustment (%) | 16.91 | 14.59 | 20.00 | 20.00 | 20.00 | 20.00 | |
Iteration 3 | Mu (ft-kip) | 69.41 | 78.52 | ||||
Rn/fc' | 0.098 | 0.111 | |||||
εt (in./in.) | 0.018 | 0.015 | |||||
Adjustment (%) | 17.68 | 15.11 | |||||
Iteration 4 | Mu (ft-kip) | 68.77 | 78.04 | ||||
Rn/fc' | 0.097 | 0.111 | |||||
εt (in./in.) | 0.018 | 0.015 | |||||
Adjustment (%) | 17.88 | 15.23 | |||||
Iteration 5 | Mu (ft-kip) | 68.60 | 77.92 | ||||
Rn/fc' | 0.097 | 0.110 | |||||
εt (in./in.) | 0.018 | 0.015 | |||||
Adjustment (%) | 17.94 | 15.26 | |||||
Iteration 6 | Mu (ft-kip) | 77.90 | |||||
Rn/fc' | 0.110 | ||||||
εt (in./in.) | 0.015 | ||||||
Adjustment (%) | 15.26 | ||||||
Final Allowable Adjustment (%) | 17.94 | 15.26 | 20.00 | 20.00 | 20.00 | 20.00 | |
2.2. Adjustment of Moments (Redistribution)
Now the engineer can make decisions to reduce any negative moments (or positive) based on project parameters including:
• Steel detailing and placement considerations.
• New design or investigation of existing beams
• Optimize the provided reinforcement for more economical design
• Optimize the provided reinforcement for improved uniformity
It was decided to reduce the negative moments on both sides of supports B and C and accept the increase in the corresponding positive moments, and not to adjust the negative moments at the exterior supports A and D.
The following figures show the unadjusted and adjusted moment values at the columns centerlines, columns faces, and at the midspan for each load pattern and for the maximum values at each critical location (maximum moment envelops).
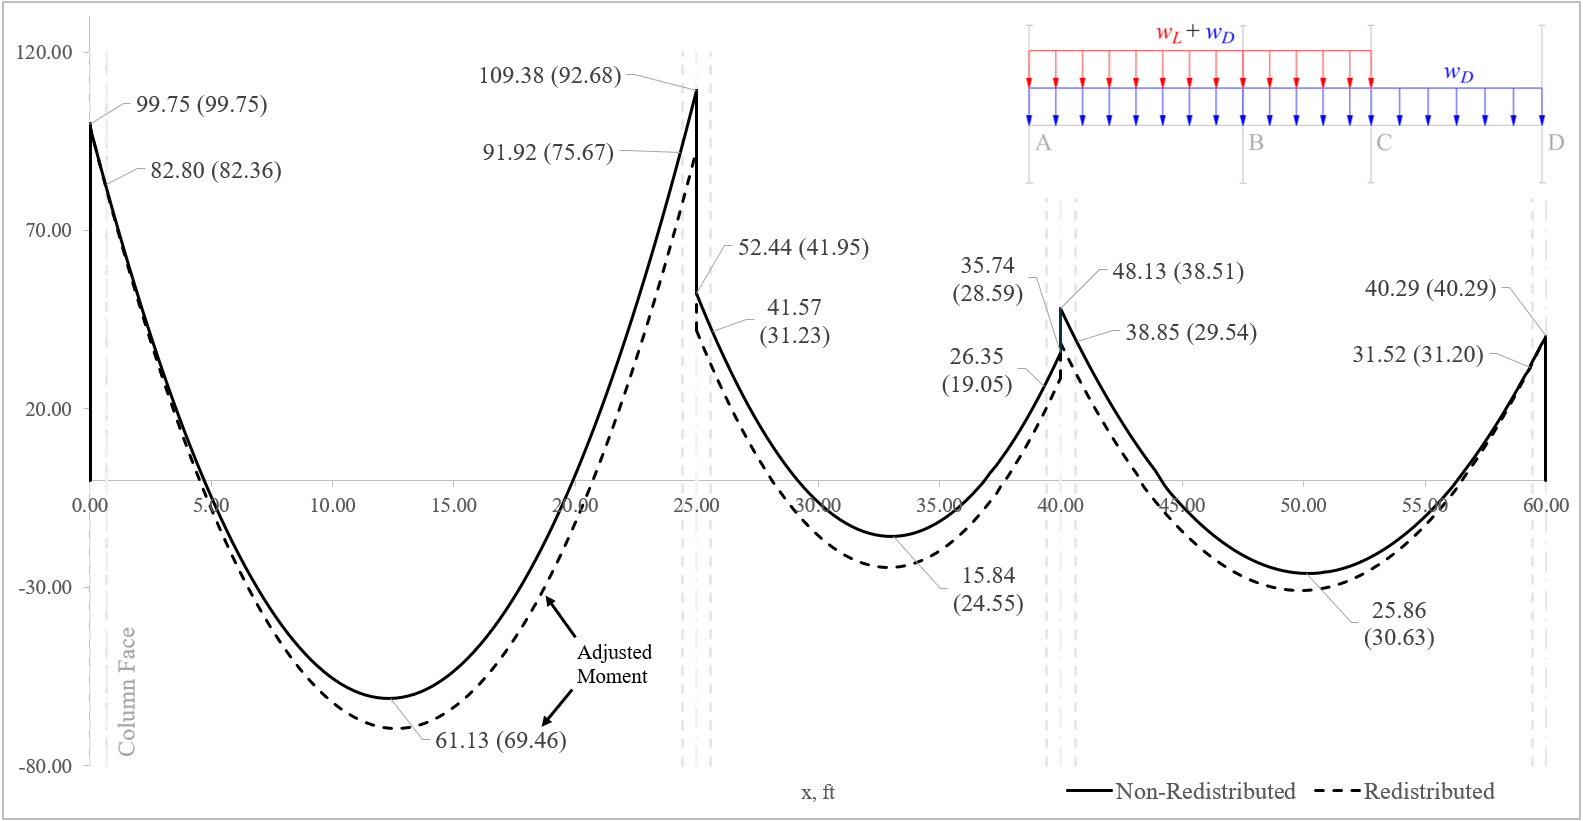
Figure 2 – Load Pattern I (moments in kip-ft)
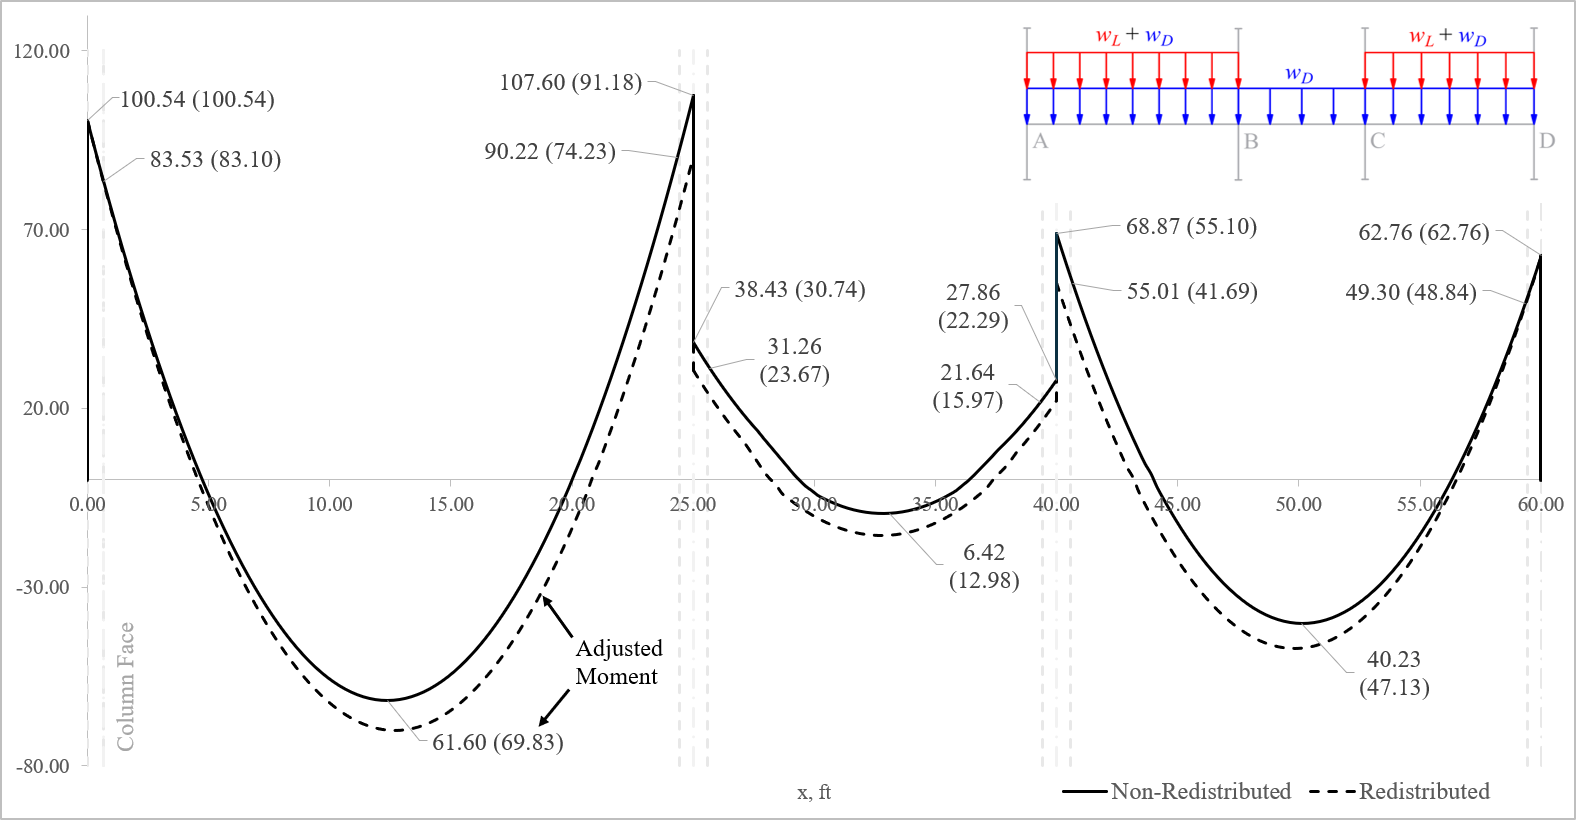
Figure 3 – Load Pattern II (moments in kip-ft)
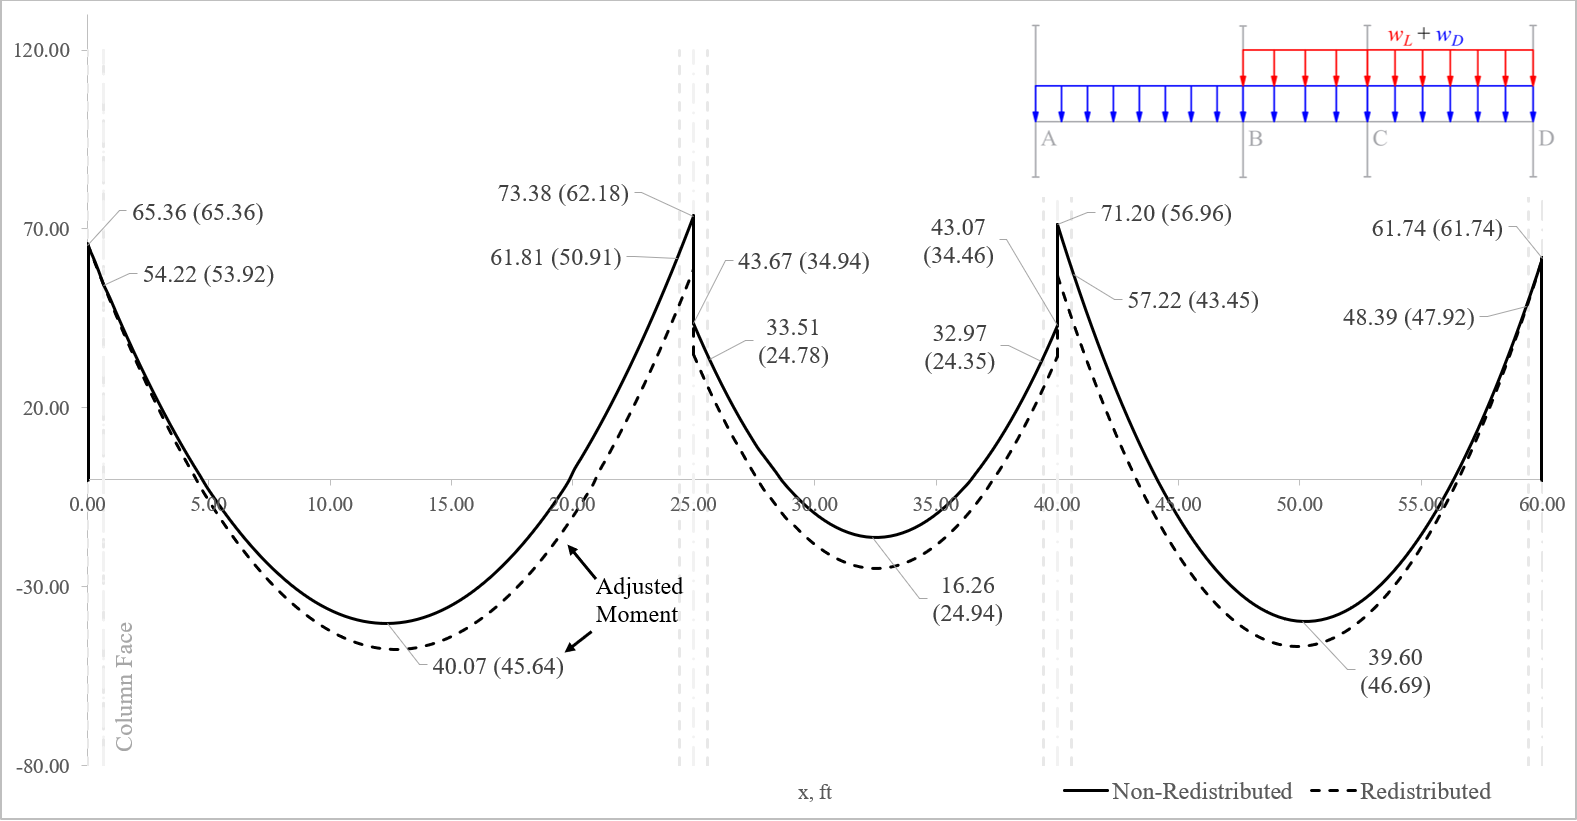
Figure 4 – Load Pattern III (moments in kip-ft)
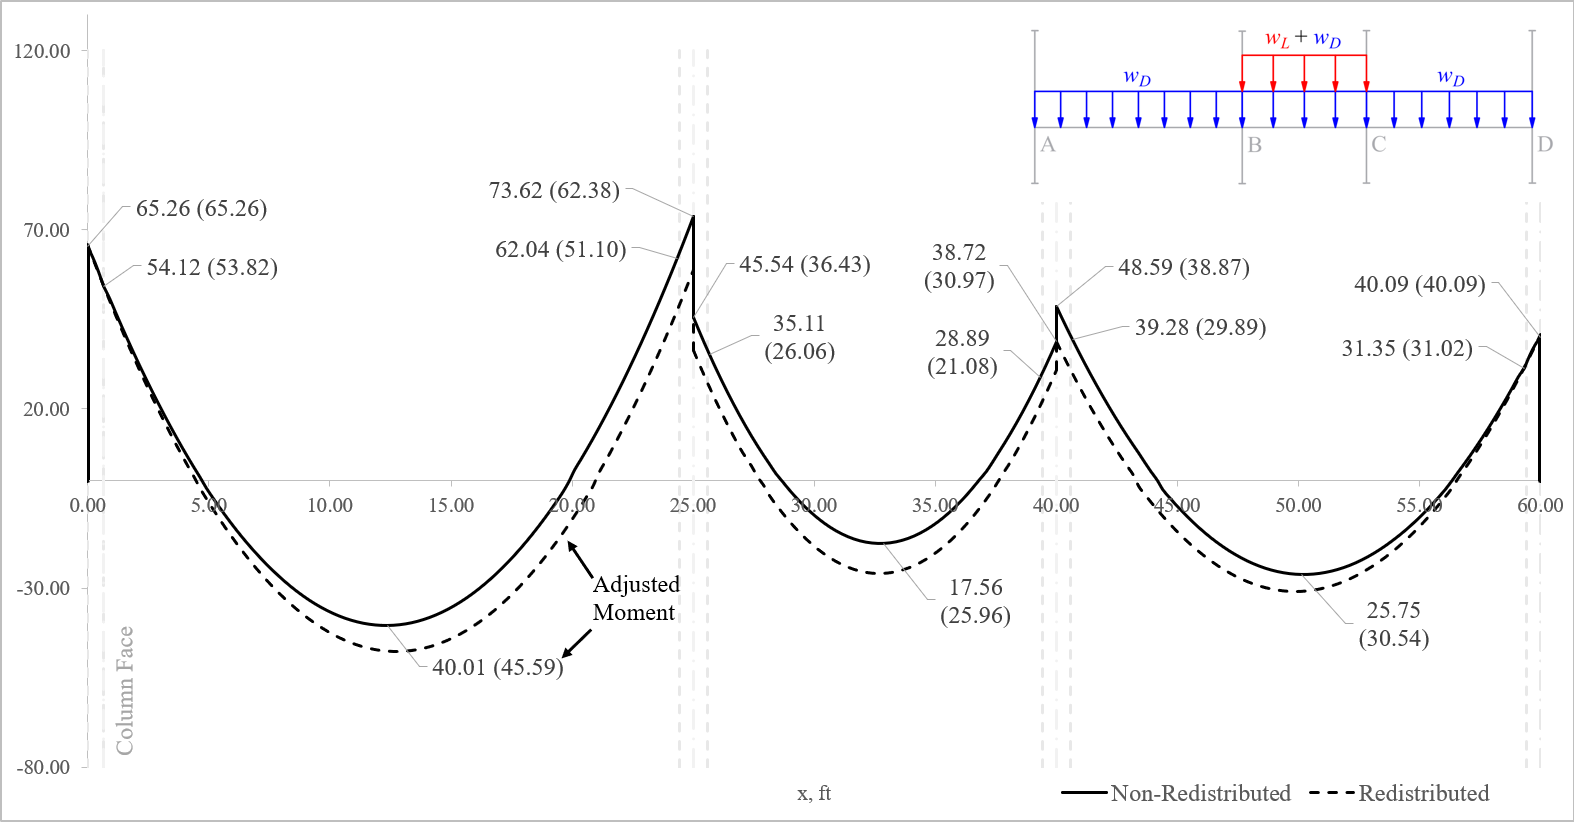
Figure 5 – Load Pattern IV (moments in kip-ft)
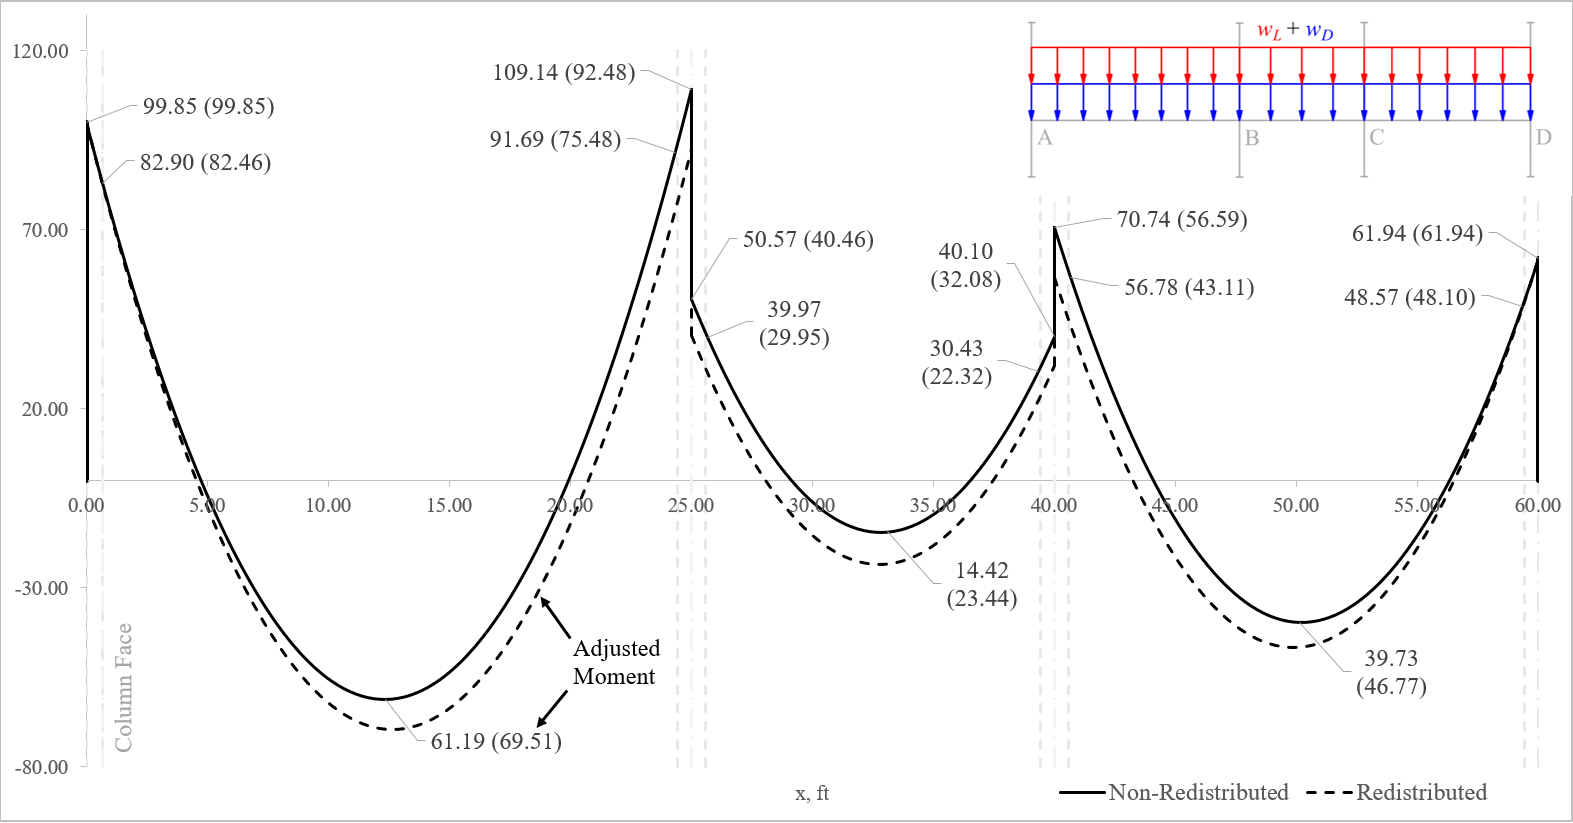
Figure 6 – Load Pattern V (moments in kip-ft)
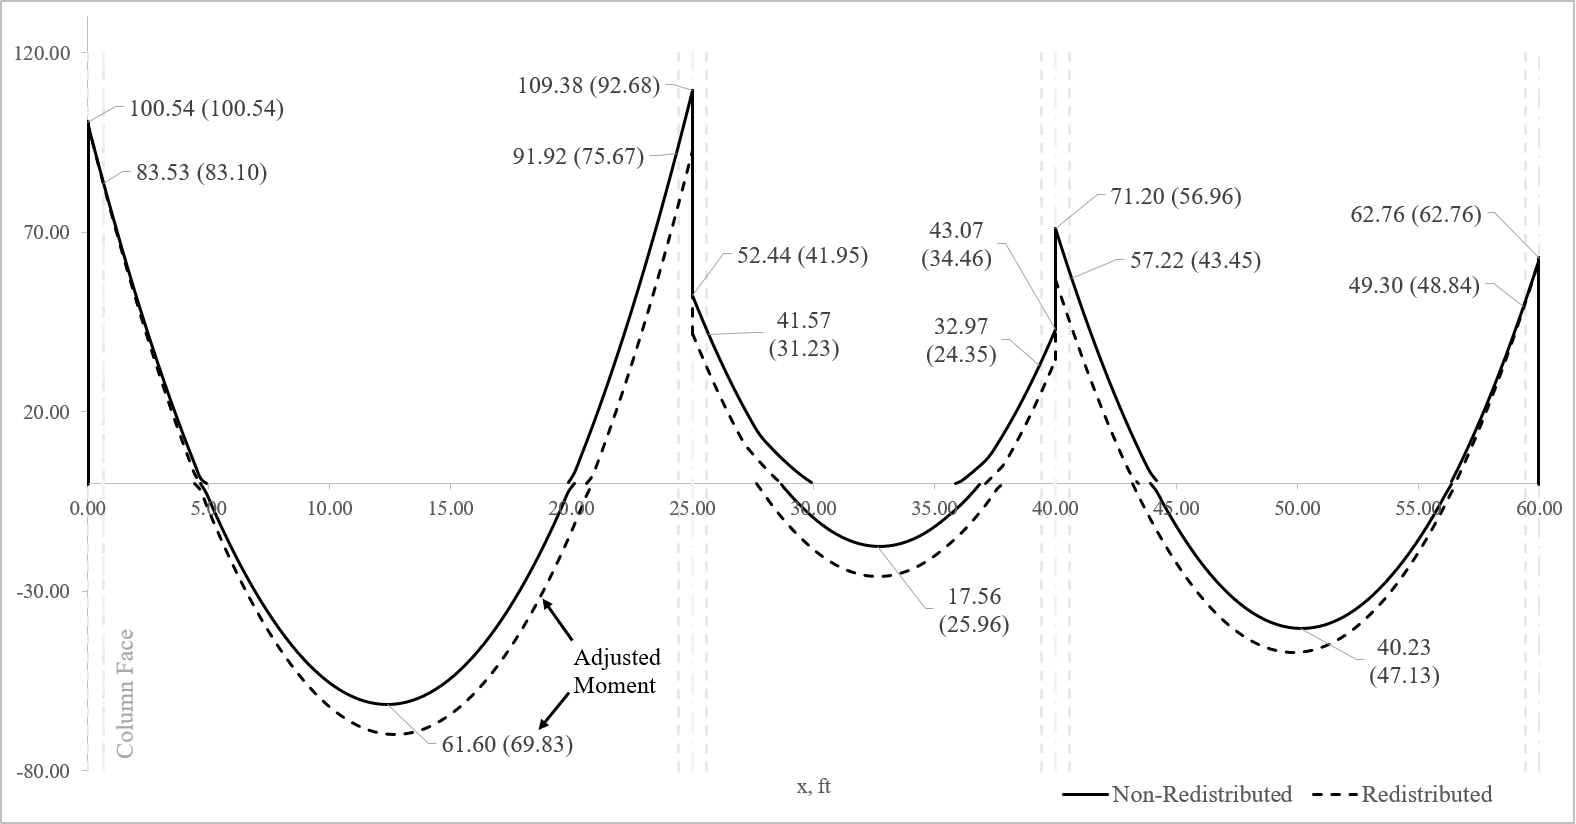
Figure 7 – Maximum Moment Envelopes for Pattern Loading (moments in kip-ft)
| |
|


Increase in positive moment in span A-B:
| |
|

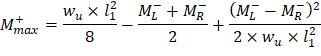
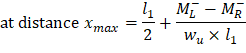
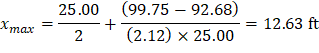
Repeat the same procedure as Section 1.6 to calculate the maximum positive moment.
| |
| |
|

Decrease in negative moment at the left face of support B
| |
| |
|


Similar calculations are made to determine the adjusted moment at other locations and for other load patterns. Results of the additional calculations are shown in the following table.
Table 3 - Moments Before and After Redistribution (Moments in kip-ft) | ||||||||||
Load Pattern I | Load Pattern II | Load Pattern III | Load Pattern IV | Load Pattern V | ||||||
Mu | Madj | Mu | Madj | Mu | Madj | Mu | Madj | Mu | Madj | |
A Center | ||||||||||
A Right Face | ||||||||||
Midspan A-B | ||||||||||
B Left Face | ||||||||||
B Left Center | ||||||||||
B Right Center | ||||||||||
B Right Face | ||||||||||
Midspan B-C | ||||||||||
C Left Face | ||||||||||
C Left Center | ||||||||||
C Right Center | ||||||||||
C Right Face | ||||||||||
Midspan C-D | ||||||||||
D Left Face | ||||||||||
D Center | ||||||||||
............. Final design moments after redistribution for critical sections (left and right support face & midspan) | ||||||||||
After the adjusted bending moments have been determined analytically, the adjusted bending moment diagrams for each load pattern can be determined. The adjusted moment curves were determined graphically and are indicated by the dashed lines in Figure 2 through Figure 6.
An Adjusted maximum moment envelope can now be obtained from the adjusted moment curves as shown in Figure 7 by dashed lines.
From the redistribution moment envelopes of Figure 7, the design factored moments and the required reinforcement area are obtained as shown in following table. Check example “One-Way Wide Module (Skip) Joist Concrete Floor System Design (ACI 318-14)” for detailed calculations for flexural and shear design of continuous beams.
Table 4 - Summary of Final Design (comparison of % reduction and required Reinforcement) | |||||||
Moment at column face | Load | As | |||||
Undistributed | Redistributed | Undistributed | Redistributed | % | |||
Support A | Right | II | |||||
Midspan A-B | II | ||||||
Support B | Left | I | |||||
Right | I | ||||||
Midspan B-C | IV | ||||||
Support C | Left | III | |||||
Right | III | ||||||
Midspan C-D | II | ||||||
Support D | Left | II | |||||
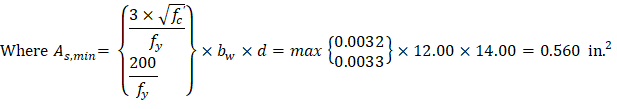
Italic underlined values indicate As,min = 0.560 in.2 governs | |||||||
| ACI 318-14 (9.6.1.2) |