


Comparison of Concrete Two-way Slab Analysis Methods (ACI 318-14)
Format: (PDF)
Author: StructurePoint (SP)
Year: 2017
Pages: 2
Two-way concrete slabs are analyzed using one of three method: Direct Design Method (DDM), Equivalent Frame Method (EFM), and Finite Element Method (FEM). A comparison of general limitations, drawbacks, advantages, and cost-time efficiency of each method is presented to assist structural engineers to determine which method to use based on the project complexity, schedule, and budget.
Comparison of Concrete Two-way Slab Analysis Methods (CSA A23.3-14)
Format: (PDF)
Author: StructurePoint (SP)
Year: 2018
Pages: 2
Two-way concrete slabs are analyzed using one of three method: Direct Design Method (DDM), Elastic Frame Method (EFM), and Finite Element Method (FEM). A comparison of general limitations, drawbacks, advantages, and cost-time efficiency of each method is presented to assist structural engineers to determine which method to use based on the project complexity, schedule, and budget.
Two-Way Joist (Waffle) Slab Design Approach and Methodology
Format: (PDF)
Author: StructurePoint (SP)
Year: 2018
Pages: 7
Waffle slab analysis and design is similar to the procedure used with flat plates except that special considerations need to be taken into account to reduce the complexity of calculations needed when using exact geometry of the two-way joists. This article summarizes all the relevant analysis and design provisions in accordance with the Equivalent Frame Method (EFM). Also, includes detailed illustration of the reference provisions in applicable standards.
Reinforced Concrete Floor Systems (2 PDH)
Format: (PDF)
Author: David Fanella, Iyad Alsamsam
Year: 2005
Pages: 8
Reinforced concrete floor systems can provide an economical solution to a wide variety of situations. Numerous types of nonprestressed and prestressed floor systems are available to satisfy virtually any span and loading condition, see Figure 1. Selecting the most effective system for a given set of constraints can be vital to achieving overall economy, especially for low- and mid-rise buildings and for buildings subjected to relatively low lateral forces where the cost of the lateral-force-resisting system is minimal.
Post-Tensioning for Two-Way Slabs (1 PDH)
Format: (PDF)
Author: Amy Reineke Trygestad
Year: 2005
Pages: 8
Every major metropolitan area is getting a facelift. Old buildings are being renovated and converted, while new construction continues to add to the skyline. Downtown living is more popular than ever, and with residential construction, two-way post-tensioned flat plates are the structural system of choice. Learn the basics of post-tensioning two-way slabs in this compact article.
Openings in Concrete Floor Slabs
Format: (PDF)
Author: Portland Cement Association (PCA)
Year: 2006
Pages: 106
Selecting locations and sizes for openings in two-way floor slabs for both new and existing structures can often be accommodated without requiring strengthening. Learn the ACI 318 provisions for selecting opening size and location in various floor slab systems and review and primer on strengthening techniques.
Two Way Concrete Slab Punching Shear Check
Format: (PDF)
Author: American Concrete Institute (ACI)
Year: 2005
Pages: 1
When using the Equivalent Frame Method (EFM) to comply with ACI 318, should structural engineers check punching shear in two-way concrete floor slabs for biaxial moments simultaneously? Dr. Jim Wight and ACI Dan Falconer help clarify this issue in a Q&A from an issue of concrete international.

Concrete Type Classification Based on Unit Density
Format: (PDF)
Author: StructurePoint (SP)
Year: 2017
Pages: 1
spSlab Program updated the unit density values for concrete types used historically to better correlate with the more detailed definitions introduced in ACI 318-08 while maintaining the unit density values pertaining to previous editions of ACI 318.

Equivalent Frame Method Design Factors for Moment Distribution
Format: (PDF)
Author: StructurePoint (SP)
Year: 2017
Pages: 2
To calculate the factored moments using the moment distribution procedure it is necessary to determine moment distribution factors and fixed-end moments for the equivalent frame members (columns and slab-beam members). The designer is required to take into account the non-prismatic nature of equivalent frames and to account for the variation in the moment of inertia along the axis of the slab-beam between supports. With the increasing use of computers for two-way slab analysis by the Equivalent Frame Method, programs such as spSlab take into account the combination of the exact geometry of column elements, torsional members, and slabbeams to complete the structural analysis and determine the design moments without the need for design aids.
Design of Deep Beams - Girders
Format: (PDF)
Author: Portland Cement Association (PCA)
Year: 1976
Pages: 12
Deign of reinforced concrete deep beams, transfer girders, or coupling beams is increasingly common. This classic document with numerical design aids has been used for decades by practicing engineers. Today nonlinear analysis programs like spWall or detailed Strut and Tie models can also be used.

Deflection Observations in Girder-Supported Beams and One-way Slabs
Format: (PDF)
Author: StructurePoint (SP)
Year: 2017
Pages: 2
When calculating deflections for beams and one-way slabs most engineers refer to their class notes from concrete 101. It is not something we do every day and why bother when I can choose minimum depth of thickness to meet deflection and serviceability criteria and avoid tedious deflection calculations entirely. Aha! optimizing slab thickness or beam depth by calculating deflections is actually very easy and can be very effective in avoiding the minimums and truly understand the structure we are designing. Understanding the boundary conditions to represent actual supports as they are constructed is critical and this article explains how to do it well in spBeam and spSlab. Read more!

Comparison of Gravity Loaded Concrete Frame Models in spBeam and spFrame under Sidesway
Format: (PDF)
Author: StructurePoint (SP)
Year: 2020
Pages: 1
This Comparison evaluates the internal force distribution in concrete beam systems under gravity loading based on a critical parameter of global frame sidesway. The same beam with gravity loads is analyzed in spBeam and spFrame and a comparison of the beam bending moments for sidesway restrained and side sway permitted is provided. This reveals a very basic yet very important consideration for engineers to take into account in the analysis of beam systems.

spSlab/spBeam Reinforcing Bar Arrangement Impact on Deflections
Author: StructurePoint (SP)
Year: 2023
Pages: 3
This technical article investigates the implications of activating the compression reinforcement solve option in spSlab spBeam, with a particular focus on how it influences bar arrangement and its subsequent impact on deflection calculations. By shedding light on this aspect, engineers and designers can gain valuable insights to make informed decisions for optimal structural analysis and design outcomes.
spSlab/spBeam Moment Redistribution Applications
Author: StructurePoint (SP)
Year: 2023
Pages: 6
This technical article examines the implications of activating the moment redistribution solve option under design and investigation run modes in spSlab/spBeam. Unlike the design run mode, the applications of moment redistribution while investigating existing as-built beams and slabs requires added care and has limitation imposed by the program. By reviewing scenarios documented in this article, engineers and designers can distinguish between several conditions based on the relationship of the required moment to the moment capacity of the member. This will provide insights to make informed decisions for optimal structural analysis and design outcomes using the moment redistribution feature.

Bundled Reinforcement in Concrete Columns and Bridge Piers
Format: (PDF)
Author: StructurePoint (SP)
Year: 2025
Pages: 2
Bundled reinforcement consists of a group of up to four reinforcing bars placed in contact to act as a unit, commonly used in concrete columns and bridge piers. This technical article discusses how spColumn treats bundled reinforcement in accordance with ACI 318-19, CSA A23.3-19, and AASHTO 9th Edition requirements. The article highlights modeling approaches for cross-sectional capacity by treating individual bars within the bundle, and clarifies code provisions for concrete cover and minimum clear spacing using an equivalent single bar diameter.
Design of Special Structural (Shear) Walls Flow Chart (ACI 318-19)
Format: (PDF)
Author: StructurePoint (SP)
Year: 2023
Pages: 1
Special structural walls are required to resist lateral wind and seismic forces and are provided with strength and detailing requirement to exhibit higher performance in seismic design categories. Additional design calculations and detailing checks ensure the added ductility and function are possible. This document show a comprehensive equation flow chart for the Design of Special Structural (Shear) Walls, employing the Compressive Stress Approach in accordance with the provisions outlined in Chapter 18 of the ACI 318-19 code.
Columns with Low Reinforcement - Architectural Columns (spColumn v10.10)
Author: StructurePoint (SP)
Year: 2023
Pages: 7
For column design, the quantity of reinforcement, both vertical and spiral, and the design strength (resistance) of the column is based on the gross area of the column section. columns are generally designed with reinforcement ratio between 1% to 8% of the gross section area. Oversized columns, widely referred to as "Architectural Columns", are often needed for functional purposes resulting in reinforcement ratios below 1%. In this article we examine how building standards treat this condition with a detailed review of the method of solution implemented in spColumn v10.10 engineering software program from StructurePoint.
Comparison of Effective Flexural Stiffness for Critical Buckling of Concrete Columns and Piers
Author: StructurePoint (SP)
Year: 2023
Pages: 6
A primary concern in calculating the critical axial buckling load (Euler buckling load in AASHTO) is the choice of the stiffness that reasonably approximates the variation in stiffness due to cracking, creep, and concrete nonlinearity. The effective flexural stiffness is used in the process of determining the moment magnification at column ends and along the column length in sway and nonsway frames. This article provides the available options to calculate the effective flexural stiffness in ACI 318, CSA A23.3, and AASHTO design codes.
Effective Flexural Stiffness for Individual Columns (ACI 318-19)
Format: (PDF)
Author: StructurePoint (SP)
Year: 2022
Pages: 3
In consideration of slenderness effects in an individual column design by Moment Magnification Method, ACI 318-19 utilizes the effective flexural stiffness, (EI)eff, of a column section to calculate the critical buckling load, Pc. The designer may utilize any of the options for (EI)eff for individual columns in ACI 318, section 6.6.4.4.4 given the available input data at the given design stage and desired level of accuracy.
Column Design with High-Strength Reinforcing Bars (ACI 318-19)
Format: (PDF)
Author: StructurePoint (SP)
Year: 2019
Pages: 5
ACI 318-19 introduced new provisions for high-strength reinforcing bars (HSRB) with 80 ksi and 100 ksi strengths. These provisions are: 1. Generalization of the strain reduction limit of steel strain in tension. 2. Upper limit for fy is introduced for maximum axial compressive strength, Pn,max, calculations. The impact of these new ACI 318-19 provisions are discussed and evaluated further by utilizing a simple design example.
Column Design Capacity Comparison with High Strength Reinforcing Bars (ACI 318-14 & ACI 318-19)
Format: (PDF)
Author: StructurePoint (SP)
Year: 2019
Pages: 5
ACI 318-19 introduced new provisions for high-strength reinforcing bars (HSRB) with 80 ksi and 100 ksi strengths. Table 21.2.2 in ACI 318-19 defines the strength reduction factor, for tension-controlled sections as an expression of fy, for all reinforcement grades. This article compares column design strength with Grade 60 and Grade 80 reinforcement while taking into account the changes in the provisions between ACI 318-14 and ACI 318-19.
Equation Flow Chart for Determining Column Slenderness Effects (ACI 318-19)
Format: (PDF)
Author: StructurePoint (SP)
Year: 2019
Pages: 1
Equation flow chart for determining column slenderness effects based on ACI 318-19 provisions
Process Flow Chart for Determining Column Slenderness Effects (ACI 318-19)
Format: (PDF)
Author: StructurePoint (SP)
Year: 2019
Pages: 1
Process flow chart for determining column slenderness effects based on ACI 318-19 provisions
Flexural Effective Stiffness for Individual Columns (ACI 318-14)
Format: (PDF)
Author: StructurePoint (SP)
Year: 2017
Pages: 1
In consideration of slenderness effects in an individual column design by Moment Magnification Method, ACI 318-14 utilizes the effective flexural stiffness, (EI)eff, of a column section to calculate the critical buckling load, Pc. The designer may utilize any of the options for (EI)eff for individual columns in ACI 318, section 6.6.4.4.4 given the available input data at the given design stage and desired level of accuracy.
Equation Flow Chart for Determining Column Slenderness Effects (ACI 318-14)
Format: (PDF)
Author: StructurePoint (SP)
Year: 2018
Pages: 1
Equation flow chart for determining column slenderness effects based on ACI 318-14 provisions
Process Flow Chart for Determining Column Slenderness Effects (ACI 318-14)
Format: (PDF)
Author: StructurePoint (SP)
Year: 2018
Pages: 1
Process flow chart for determining column slenderness effects based on ACI 318-14 provisions
Equation Flow Chart for Determining Column Slenderness Effects (ACI 318-11)
Format: (PDF)
Author: StructurePoint (SP)
Year: 2021
Pages: 1
Equation flow chart for determining column slenderness effects based on ACI 318-11 provisions
Process Flow Chart for Determining Column Slenderness Effects (ACI 318-11)
Format: (PDF)
Author: StructurePoint (SP)
Year: 2021
Pages: 1
Process flow chart for determining column slenderness effects based on ACI 318-11 provisions
Equation Flow Chart for Determining Column Slenderness Effects (CSA A23.3-14)
Format: (PDF)
Author: StructurePoint (SP)
Year: 2018
Pages: 1
Equation flow chart for determining column slenderness effects based on CSA A23.3-14 provisions
Process Flow Chart for Determining Column Slenderness Effects (CSA A23.3-14)
Format: (PDF)
Author: StructurePoint (SP)
Year: 2018
Pages: 1
Process flow chart for determining column slenderness effects based on CSA A23.3-14 provisions
Flexural Stiffness for Individual Columns (CSA A23.3-14)
Format: (PDF)
Author: StructurePoint (SP)
Year: 2018
Pages: 2
In consideration of slenderness effects in an individual column design by Moment Magnification Method, CSA A23.3-14 utilizes the flexural stiffness, EI, of a column section to calculate the critical buckling load, Pc. The designer may utilize any of the options for EI for individual columns in CSA A23.3-14 given the available input data at the given design stage and desired level of accuracy.
Effects of M2,min on Slenderness Calculations for Non-Sway Column per CSA A23.3
Format: (PDF)
Author: StructurePoint (SP)
Year: 2019
Pages: 16
Provisions for minimum moment, M2,min, effects on slenderness calculations for non-sway columns per CSA A23.3 has gone through significant changes in the 2004, 2014, and 2019 code cycles. The 2019 edition of CSA A23.3 introduced significant conservatism to non-sway column designs in both slenderness consideration and the moment magnification phases. This article outlines and discusses the evolution of CSA A23.3 in slenderness calculations for non-sway columns where the largest first-order moment, M2, is less than the minimum moment, M2,min.

Equation Flow Chart for Determining Column Slenderness Effects (CSA A23.3-19)
Format: (PDF)
Author: StructurePoint (SP)
Year: 2019
Pages: 1
Equation flow chart for determining column slenderness effects based on CSA A23.3-19 provisions
Process Flow Chart for Determining Column Slenderness Effects (CSA A23.3-19)
Format: (PDF)
Author: StructurePoint (SP)
Year: 2019
Pages: 1
Process flow chart for determining column slenderness effects based on CSA A23.3-19 provisions
Columns with Low Reinforcement - Architectural Columns (spColumn v7.00)
Format: (PDF)
Author: StructurePoint (SP)
Year: 2018
Pages: 5
For column design, the quantity of reinforcement, both vertical and spiral, and the design strength (resistance) of the column is based on the gross area of the column section. columns are generally designed with reinforcement ratio between 1% to 8% of the gross section area. Oversized columns, widely referred to as "Architectural Columns", are often needed for functional purposes resulting in reinforcement ratios below 1%. In this article we examine how building standards treat this condition with a detailed review of the method of solution implemented in spColumn v7.00 engineering software program from StructurePoint.

Over the past 35 years, concrete bridge pier design capacity under combined axial and flexural loads has been impacted by the code evolutions. Key changes are highlighted by this article to better inform bridge and building structural engineers as they support and influence key infrastructure decisions at the national and local levels. For a typical bridge pier section, two interaction diagrams are superimposed to compare and contrast capacity before and after the introduction of major code changes at the beginning of the century.
Design Column Boundary Conditions in Slenderness Calculations
Format: (PDF)
Author: StructurePoint (SP)
Year: 2019
Pages: 2
This article provides notes that are helpful when using spColumn to calculate the k value for some of the special boundary conditions cases.
Column Section Demand-Capacity Ratio Determination
Format: (PDF)
Author: StructurePoint (SP)
Year: 2020
Pages: 2
Most engineers are interested in finding the safety margin for column sections under consideration for each loading conditions. This article is provided to illustrate how to interpret the output for the margin provided (Capacity to Demand Ratio (DCR)) in the spColumn output.
Equation Flow Chart for Determining Wall Shear Strength Provided by Concrete (ACI 318-19)
Format: (PDF)
Author: StructurePoint (SP)
Year: 2024
Pages: 1
Equation flow chart for determining wall shear strength provided by concrete based on ACI 318-19 provisions.
Process Flow Chart for Determining Wall Shear Strength Provided by Concrete (ACI 318-19)
Format: (PDF)
Author: StructurePoint (SP)
Year: 2024
Pages: 1
Process flow chart for determining wall shear strength provided by concrete based on ACI 318-19 provisions.

Equation Flow Chart for Determining Wall Shear Strength Provided by Concrete (ACI 318-14)
Format: (PDF)
Author: StructurePoint (SP)
Year: 2023
Pages: 1
Equation flow chart for determining wall shear strength provided by concrete based on ACI 318-14 provisions.
Process Flow Chart for Determining Wall Shear Strength Provided by Concrete (ACI 318-14)
Format: (PDF)
Author: StructurePoint (SP)
Year: 2023
Pages: 1
Process flow chart for determining wall shear strength provided by concrete based on ACI 318-14 provisions.
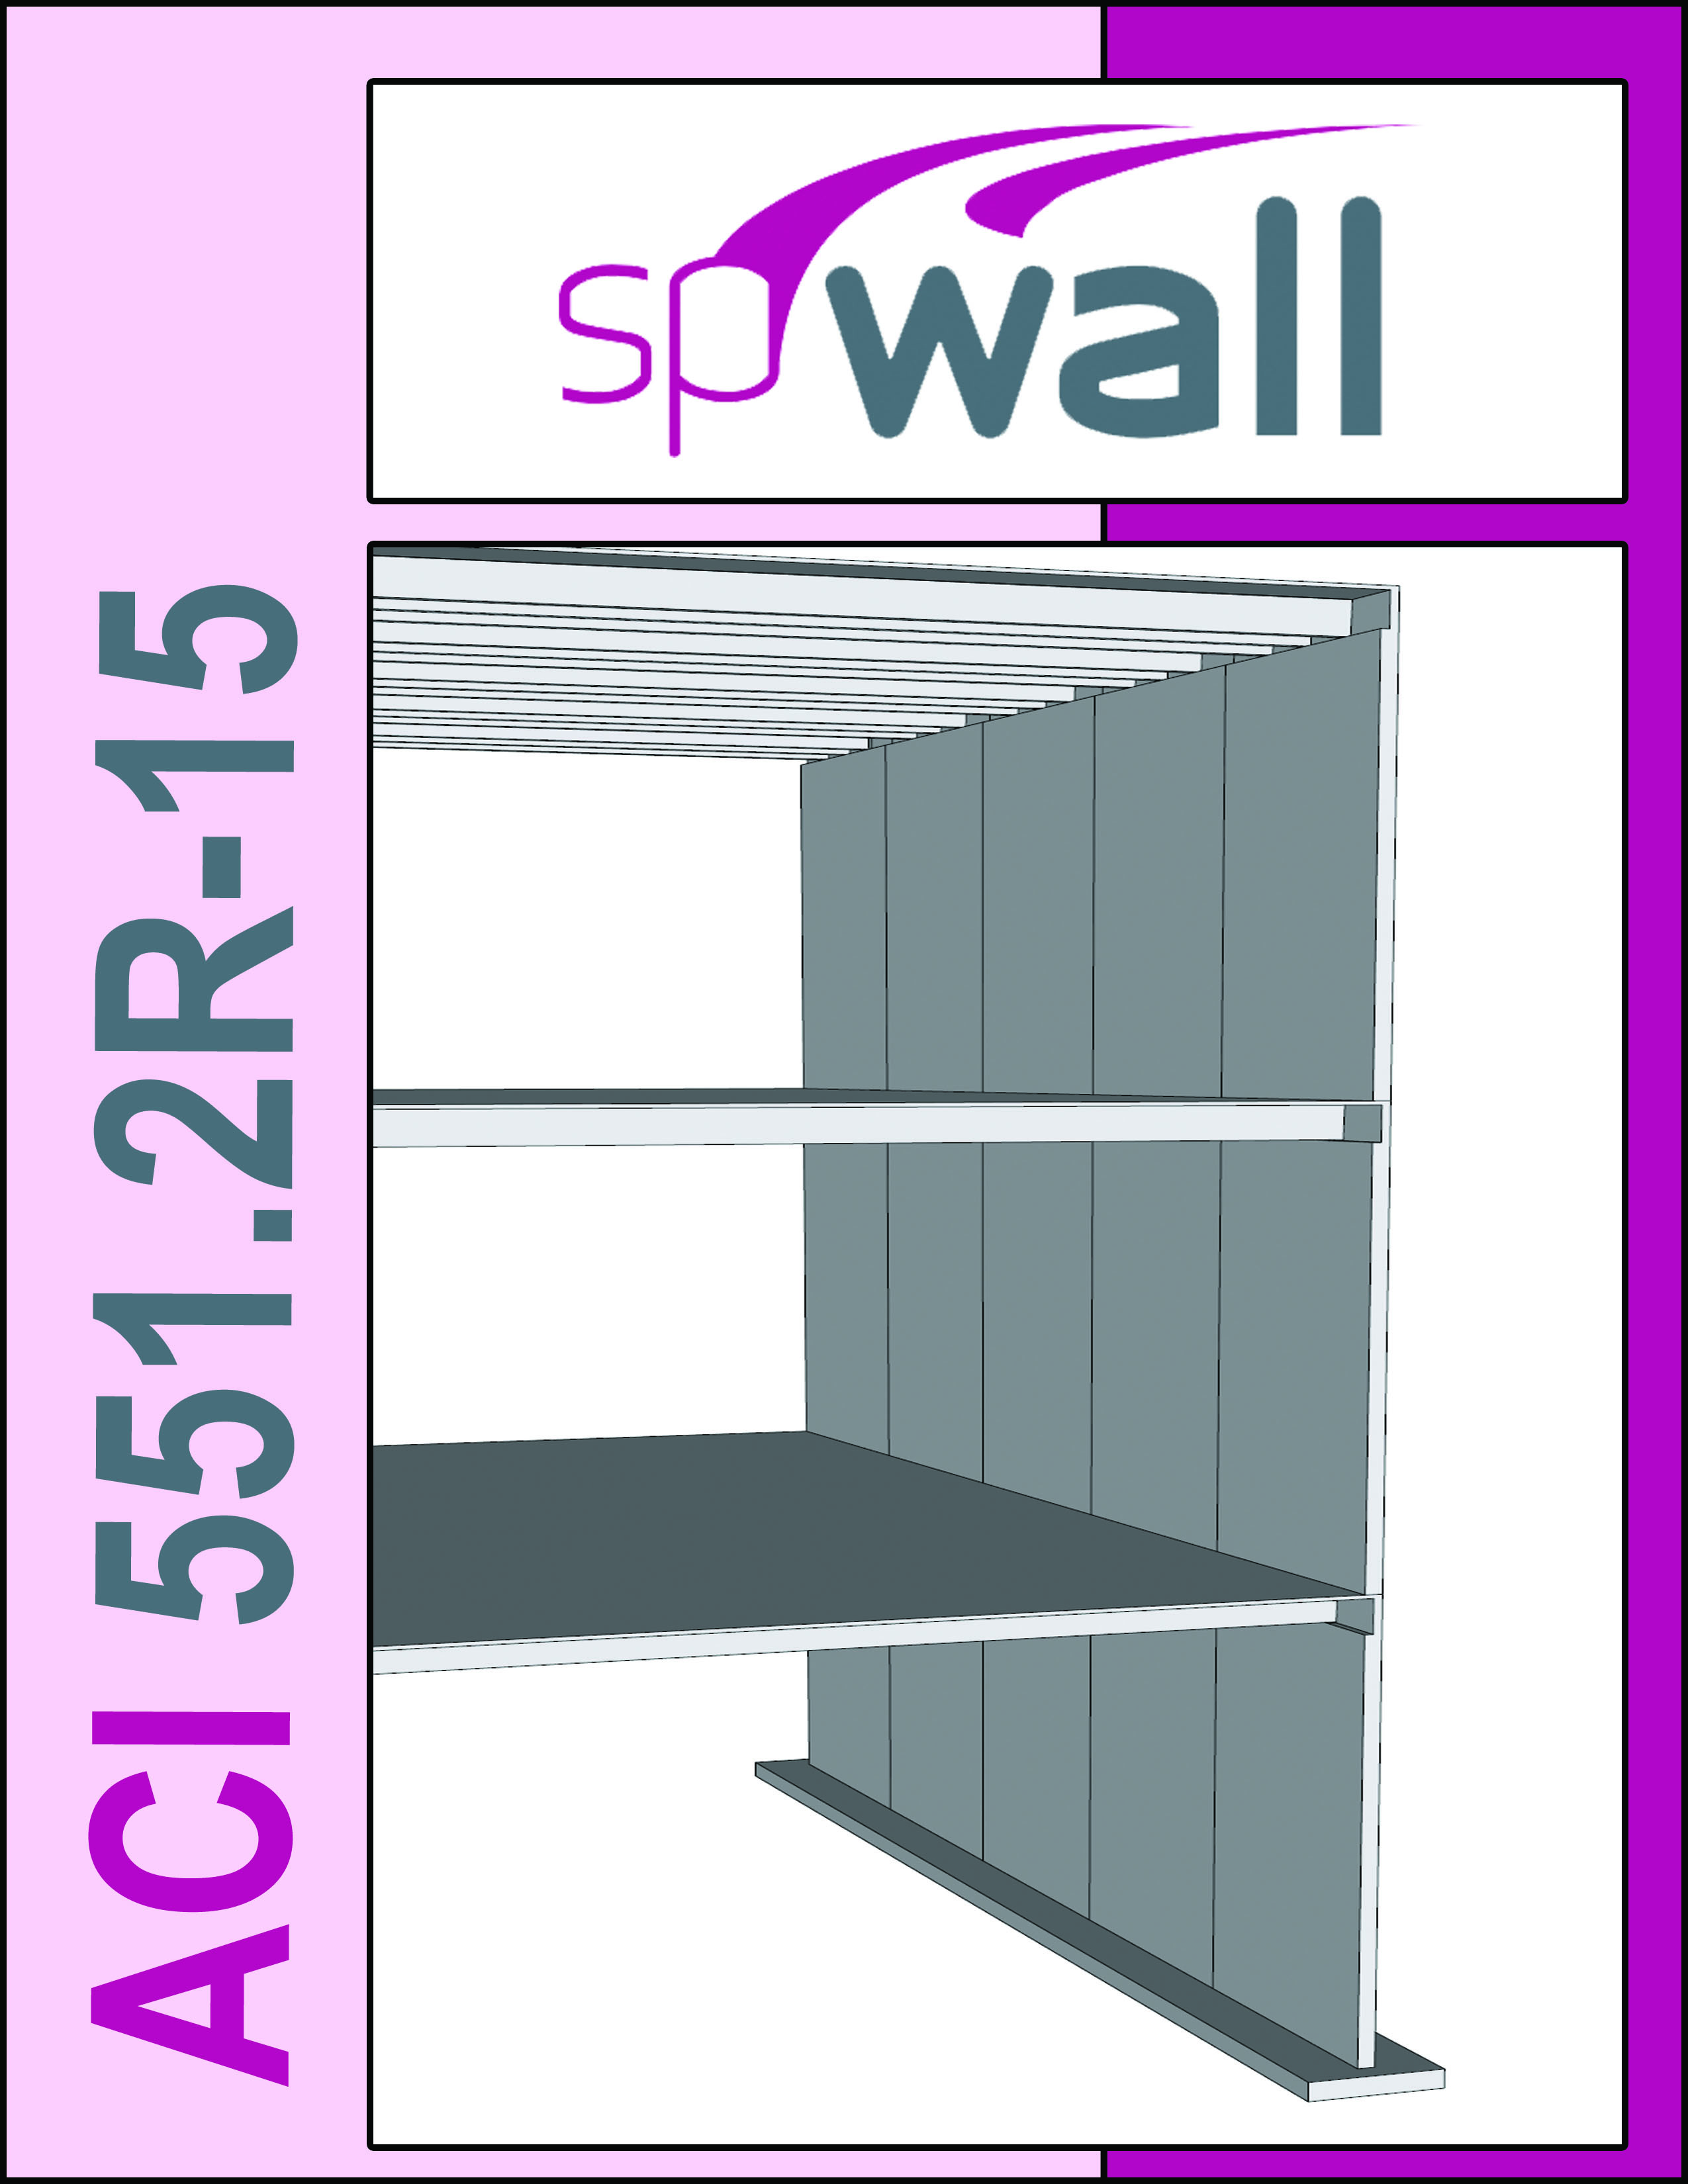
Commentary on Multi-Story Tilt-Up Panel Design (ACI 318-14 - ACI 551.2R-15)
Format: (PDF)
Author: StructurePoint (SP)
Year: 2023
Pages: 6
Commentary on Multi-Story Tilt-Up Wall Panel Design based on the comprehensive procedure provided by ACI 551.2R-15 and the provisions of the American code (ACI 318-14). A detailed supplement to design examples for continuously supported wall panel. Provides a critical examination of moment magnification when using the alternative method for out-of-plan slender wall analysis.

Cracking Coefficient and Effective Flexural Stiffness of Concrete Walls
Format: (PDF)
Author: StructurePoint (SP)
Year: 2023
Pages: 2
The cracking coefficient for tilt-up wall panels can be calculated using different ACI 318 provisions. This article discusses and compares the commonly used provisions in ACI 318-14 to calculate the cracked (or effective) moment of inertia used in the cracking coefficient calculations required for spWall models.
Commentary on Multi-Story Tilt-Up Panel Design (ACI 318-11 - ACI 551.2R-15)
Format: (PDF)
Author: StructurePoint (SP)
Year: 2018
Pages: 4
Commentary on Multi-Story Tilt-Up Wall Panel Design Using ACI 551.2R-15. A detailed supplement to design examples for continuously supported wall panel. Provides a critical examination of moment magnification when using the alternative method for out-of-plan slender wall analysis.
Effective Flexural Stiffness for Cracked Moment of Inertia of Concrete Walls
Format: (PDF)
Author: StructurePoint (SP)
Year: 2019
Pages: 2
The cracked moment of inertia for tilt-up wall panels can be calculated using different ACI 318 provisions. This article discusses and compares the commonly used provisions in ACI 318-14 to calculate the cracked moment of inertia.

Structural Wall Reinforcement Design Considerations
Format: (PDF)
Author: StructurePoint (SP)
Year: 2017
Pages: 2
Structural walls are frequently designed with out of plane loads and two curtains of reinforcement. spWall has an option for design of walls with two curtains of reinforcement as well as one curtain of reinforcement to accommodate various needed wall thicknesses. The proper consideration of this condition as provided by spWall is important to ensure the successful performance of compression reinforcement in the wall section.
Flow Chart for Determining Governing Reinforcement
Format: (PDF)
Author: StructurePoint (SP)
Year: 2025
Pages: 2
This flow chart outlines how spMats determines the governing flexural reinforcement per layer. The program evaluates the element face (tension or compression) and considers four criteria: reinforcement from analysis (Design), code minimum and maximum limits, and optional user-defined "Base" reinforcement. Based on these inputs and user settings, spMats selects the appropriate governing reinforcement while ensuring code compliance or flagging any violations.

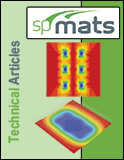
Finite Element Mesh Sizing Influence on Mat Foundation Reinforcement
Format: (PDF)
Author: StructurePoint (SP)
Year: 2017
Pages: 5
Is smaller mesh always better in Finite Element Analysis modeling of concrete mat foundations and slabs on grade?? Do higher moments produce more reinforcement area? Sure! but what about the total area I need for my mat slab? Can spMats produce answer to all these questions with speed and accuracy? Read the rest of this article!
Finite Element Aspect Ratio Influence in Concrete Foundation Models
Format: (PDF)
Author: StructurePoint (SP)
Year: 2017
Pages: 2
When creating analytical models for design of foundation systems it is not always possible to achieve square elements with the best possible aspect ratio of 1. In this article we examined and report the findings when using a range of aspect ratios to determine any loss of computational accuracy in model results. Recommendations for spMats users are also provided.

Pile Reaction Distribution in Pile Cap Foundations
Format: (PDF)
Author: StructurePoint (SP)
Year: 2017
Pages: 2
Pile cap foundations are widely designed using helpful guides such as the CRSI handbook or PCA notes. Finite elements programs such as spMats provide simple and quick alternatives to the limited range provided in traditional guides. Quick iterations inform the engineer about the sensitivity of the solution to various parameters and simply identify the critical or governing ones. In this article the impact of the pile stiffness and pile distribution is investigated as part of the overall pile cap behavior.
Corn Products International is replacing a worn-out coal-fired power plant with a building a state-of-the-art power plant that will burn high-sulfur Illinois coal and meet all current emissions requirements. Corn Products use PCAMats to design a 4.5 foot thick reinforced mat slab consisting of 3819 cubic yards of concrete.
Modeling Construction Joints Structural Foundations in spMats
Format: (PDF)
Author: StructurePoint (SP)
Year: 2017
Pages: 1
In structural mat foundations and slabs on grade, construction joints are typically required to transfer vertical shear force between adjacent concrete placements. Transfer of moments across the joint may or may not be required. There are two possible ways to model a construction joints in pcaMats to analyze and design a concrete foundation where only shear is transferred and moment is not.
Soil bearing capacity, soil compressibility, and soil modulus of subgrade reaction are various measures of strength-deformation properties of soil. The allowable soil bearing capacity is the maximum pressure that can be permitted on foundation soil with adequate safety against soil rupture or excessive settlement. Another soil characteristic, compressibility of cohesive soils, determines the amount of long-term settlement under load.

Foundation Slabs Supported by Dissimilar Soils
Format: (PDF)
Author: StructurePoint (SP)
Year: 2017
Pages: 3
An existing L-shaped foundation slab (supported by Soil 1) will undergo expansion (supported by Soil 2). On the expansion side, the soil subgrade modulus is 100 kcf because the contractor could not match the soil properties under the existing foundation slab, which is 200 kcf. spMats v8.10 software program is utilized to investigate the impact of the dissimilar soils on the alculated bearing pressure for the combined foundation as well as other design parameters such as displacement, bending moments, and required reinforcement.

Industrial Floor Slab on Grade with Single Layer of Reinforcement
Author: StructurePoint (SP)
Year: 2024
Pages: 4
Ground supported slabs in industrial and residential floors are frequently designed with a single layer of reinforcement. Such slabs are referred to as membrane slabs, floating slabs, or filler slabs and range in thickness from as little as 4 to 8 inches depending on the supported loads. In warehouses and storage facilities such slabs are subjected to concentrated point loads from storage rack posts or forklift wheel loads.

Fiber Reinforced Concrete (FRC) Industrial Floor Slabs on Grade
Author: StructurePoint (SP)
Year: 2024
Pages: 4
Ground supported slabs in industrial and residential floors may be specified with fiber reinforcement in lieu of a single layer of reinforcing or welded wire fabric. Fiber reinforced concrete (FRC) slabs are referred to as membrane slabs, floating slabs, or filler slabs and range in thickness from as little as 4" to 8" depending on the supported loads. In warehouses and storage facilities such slabs may be subjected to concentrated point loads from storage rack posts or forklift wheel loads. FRC can be used with conventional reinforcing as a hybrid system in foundations and walls to meet construction quality and schedule.
Plain Unreinforced Concrete Slabs on Grade
Author: StructurePoint (SP)
Year: 2024
Pages: 3
Ground supported slabs with light loading and residential flooring are frequently designed without reinforcing (unreinforced). Such plain concrete slabs are referred to as membrane, floating, or filler slabs and range in thickness from as little as 4" to 8" depending on the supported loads. In warehouses and storage facilities such slabs are subjected to concentrated point loads from storage rack posts or forklift wheel loads.
Finite Element Mesh Density Influence on spMats Model Results
Format: (PDF)
Author: StructurePoint (SP)
Year: 2017
Pages: 3
Structural engineers routinely ask us about the influence of mesh density on the results obtained from spMats models. In any Finite Element Analysis (FEA), individual finite elements can be visualized as small pieces of a structure and particular arrangements of these elements is known as a mesh. Mesh density in FEA is defined as the number of elements used in modeling a given structure.

Ultimate Load Factor Design for Spread Footing and Mat Foundations
Format: (PDF)
Author: American Concrete Institute (ACI)
Year: 2010
Pages: 2
Footing design requires load factors for calculation of pressure distribution and determination of soil contact area for all service and ultimate load combinations. Major differences between service and ultimate design conditions can exist. spMats Program users often ask about this and possible uplift? Dr. Jim Wight and ACI-318 members help clarify this issue in a Q&A from an issue of CI.
Structural Integrity Requirements (1 PDH)
Format: (PDF)
Author: M. E. Kamara, Mike Mota
Year: 2006
Pages: 8
Structures capable of safely supporting all conventional design loads may suffer local damage from severe, local abnormal loads, such as explosions caused by gas or industrial liquids, vehicle impact, or impact of local effects from very high winds such as those recorded in tornadoes. Generally, such abnormal loads or events are not design considerations. However, basic structural intergrity is an essential feature for limiting dissporportionate damamge and utlimately achieveing building resilience, durability, and serviceability
Engineering Mass Concrete Structures (1 PDH)
Format: (PDF)
Author: John Gajda, Iyad Alsamsam
Year: 2006
Pages: 8
Mass concrete is all around us. Traditionally, mass concrete has been associated with dams and other extremely large placements. This is no longer the case. Larger placements for economy and the use of concretes with high cement contents for durability and rapid strength gain mean that an increasing number of concrete placements must be treated as mass concrete. Learn the basics of mass concrete specification and mitigation techniques of damaging effect of excessive heat of hydration.
Torsion Design of Structural Concrete Based (1 PDH)
Format: (PDF)
Author: M. E. Kamara, B. G. Rabbat
Year: 2007
Pages: 8
Upon reading the article and completing the quiz, the reader should be able to understand the behavior and design of structural concrete members subjected to torsion. The article presents the American Concrete Institute Building Code (ACI 318) design provisions and detailing requirements for torsion design.
Strut-and-Tie Model for Structural Concrete Design (1 PDH)
Format: (PDF)
Author: Attila Beres, B. G. Rabbat
Year: 2007
Pages: 8
This article sponsored by StructurePoint discusses the strut-and-tie model in concrete structures. Upon reading the article, the reader should be able to understand the basic principles and the related ACI 318-05 Code requirements for Strut-and-tie modeling, analysis, design and detailing of deep beam members in buildings and bridges.
The key to designing economical reinforced concrete structures is not optimization of the material quantities. Rather, the key is constructability. Successful concrete building design must include consideration of the building process, sequencing, forming, shoring, and staging. Formwork consideration affect over 50% of the building framing construction cost. This article focuses on economical concrte building formwork selection.
Two-day Construction Cycle for High-Rise Structures Based on Use of Preshores
Format: (PDF)
Author: Jacob Grossman
Year: 1986
Pages: 5
Classic article by a renowned engineer and formost expert in concrete floor systems. Reflecting on how New york city engineers and contractors have perfected the two-day construction cycle for flat plate and flat slab high-rise buildings. A step by step procedure to achieve construction efficiency using preshores during the stripping of primary forms and shores while maintaining safety. Must read for any concrete designer!
Concrete Building Members - Assembling Loads
Format: (PDF)
Author: Amy Reineke Trygestad
Year: 2005
Pages: 5
An essential primer on the origin of loads and combinations necessary for the analysis and design of reinforced concrete members. Detemine everything the concrete member will support and make sure you account for all loads needed for design. Article provides a summary of external and internal the engineers needs to consider in any concrete building or bridge desing project.
Design of Concrete Structures for Fire Effects
Format: (PDF)
Author: Amy Reineke Trygestad
Year: 2005
Pages: 4
For any concrete building or structure, the governing code will require provisions to achieve a specific fire rating. Building owner may require your design to comply with stricter fire design requirements. Learn the basics of fire endurance in selection and design of reinforced concrete member design. This article will provide you a primer and basic understanding of fire effects and rating of concrete structures.
Structural Integrity Requirements for Concrete Buildings
Format: (PDF)
Author: Portland Cement Association (PCA)
Year: 2006
Pages: 6
Concrete structures capable of safely supporting all conventional design loads may suffer local damage from severe local abnormal loads,such as explosions due to gas or industrial liquids, or vehicle impact. The ability of concrete buildings to withstand blast loads can be substantially enhanced with minor changes in reinforcement detailing. Explore ACI 318 concrete design and detailing requirements to provide continuity, redundancy, and increase ductility of concrete buildings.
Primer - Blast and Progressive Collapse Effects on Buildings
Format: (PDF)
Author: Portland Cement Association (PCA)
Year: 2006
Pages: 8
Primer introducing progressive collapse as a situation where local failure of a primary structural component(s) leads to the collapse of adjoining members, in turn leading to additional collapse. Hence, the extent of total damage is disproportionate to the original cause. Blast effects often result in a chain reaction or propagation of failures following damage to a relatively small portion of a structure.
ACI 318-19 Code Revisions Impact on StructurePoint Software
Format: (PDF)
Author: StructurePoint (SP)
Year: 2019
Pages: 10
ACI 318-19 continues to unify and simplify code provisions started in 2014 reorganization of chapters by members. Nearly all the changes with software impact pertain to the design of beams and slabs in floor systems. While vertical and foundation elements are not as significantly impacted.